Pivot Table Totals Rows and Columns
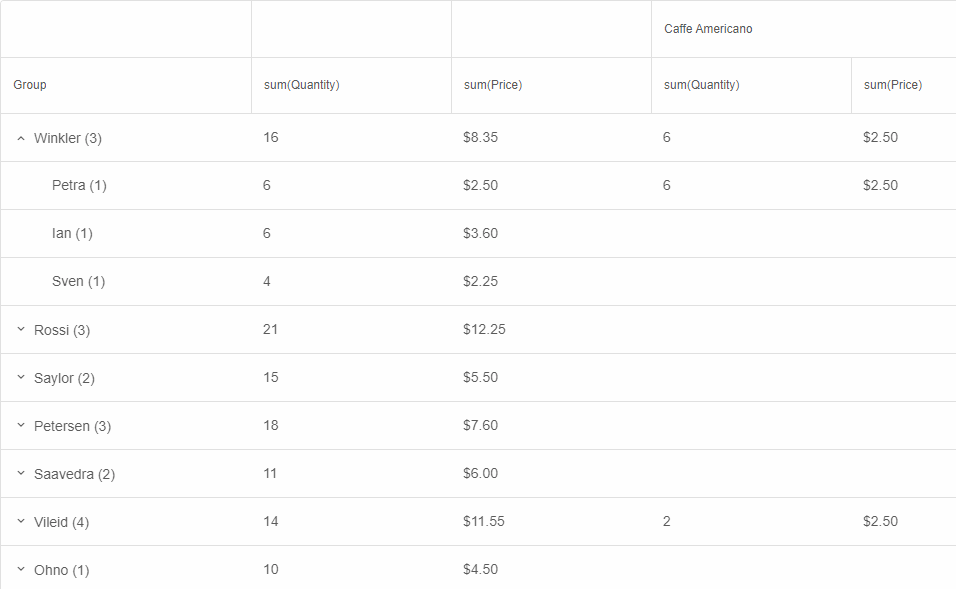
Smart.PivotTable summarizes tabular data that was originally displayed in a Grid or Table. Sometimes it can be useful for the data aggregated and shown in particular Pivot Table cells to be itself summarized in order to offer users a quick overview. Smart.PivotTable offers three types of such aggregation:
Pivot Table Row Totals Columns
In Smart.PivotTable, Row Totals Columns can be enabled by setting the property rowTotals to true. When enabled, one row totals column per summary column will be displayed with cells summarizing all cells in a row. The summary function used in a row totals column corresponds to the summary function of the columns being aggregated.
By default, Row Totals Columns appear next to the Group column. This behavior is controlled by the property rowTotalsPosition with two possible values:
- 'near' (default) - columns appear on the side nearest to the group column.
- 'far' - columns appear on the side farthest from the group column.
Pivot Table Column Totals Columns
In Smart.PivotTable, Column Totals Columns can be enabled by setting the property columnTotals to true. When enabled, a Column Totals column is displayed for each level of pivot column hierarchy. Column Totals Columns contain cells summarizing the cells in all summary columns in the current pivot hierarchy. They can be expanded and collapsed (default), allowing for focusing on the larger scale of data first and drilling down by expanding a Totals Column if necessary. A column can be toggled by pressing the arrow in the column header.
Important: When Column Totals Columns are enabled, all summary columns must have the same summary function (e.g. 'sum' or 'avg'), otherwise Column Totals Columns cannot be aggregated.
By default, Column Totals Columns appear on the side of the Group column. This behavior is controlled by the property columnTotalsPosition with two possible values:
- 'near' (default) - columns appear on the side nearest to the group column.
- 'far' - columns appear on the side farthest from the group column.
Pivot Table Grand Total Row
All displayed rows in Smart.PivotTable can be summarized in one Grand Total Row that appears in the table's footer when the property grandTotal is set to true.

The Grand Total Row is always sticky and will appear at the bottom even if the Pivot Table has a vertical scrollbar.
Drill Down
If the property drillDown is enabled, the user can double-click a cell from a Row Totals Column, Column Totals Column, or the Grand Total Row to show a Smart.Table in a dialog with all original records aggregated in the clicked cell.