Guides
The agent
On this page · 17 sections
The agent is one Node.js program, studio/agent/agent.js, with no dependency. It owns the connections to the plant and the instruments (OPC UA, Modbus, SCPI, VISA, DAQmx), publishes their tags to the browser over one WebSocket, serves the published apps and the designer, runs the flows marked for it, and writes the logs. Version 1.18.0. It is part of the Scada Studio package (scada-studio-1.18.0.zip: the designer, the agent, the component runtime, this documentation), which comes with a licence - see Licensing; the designer on this site runs without it, against simulated sources.
Running it
node agent.js                              agent.config.json next to it, port 8800
node agent.js --config line3.json --port 8801
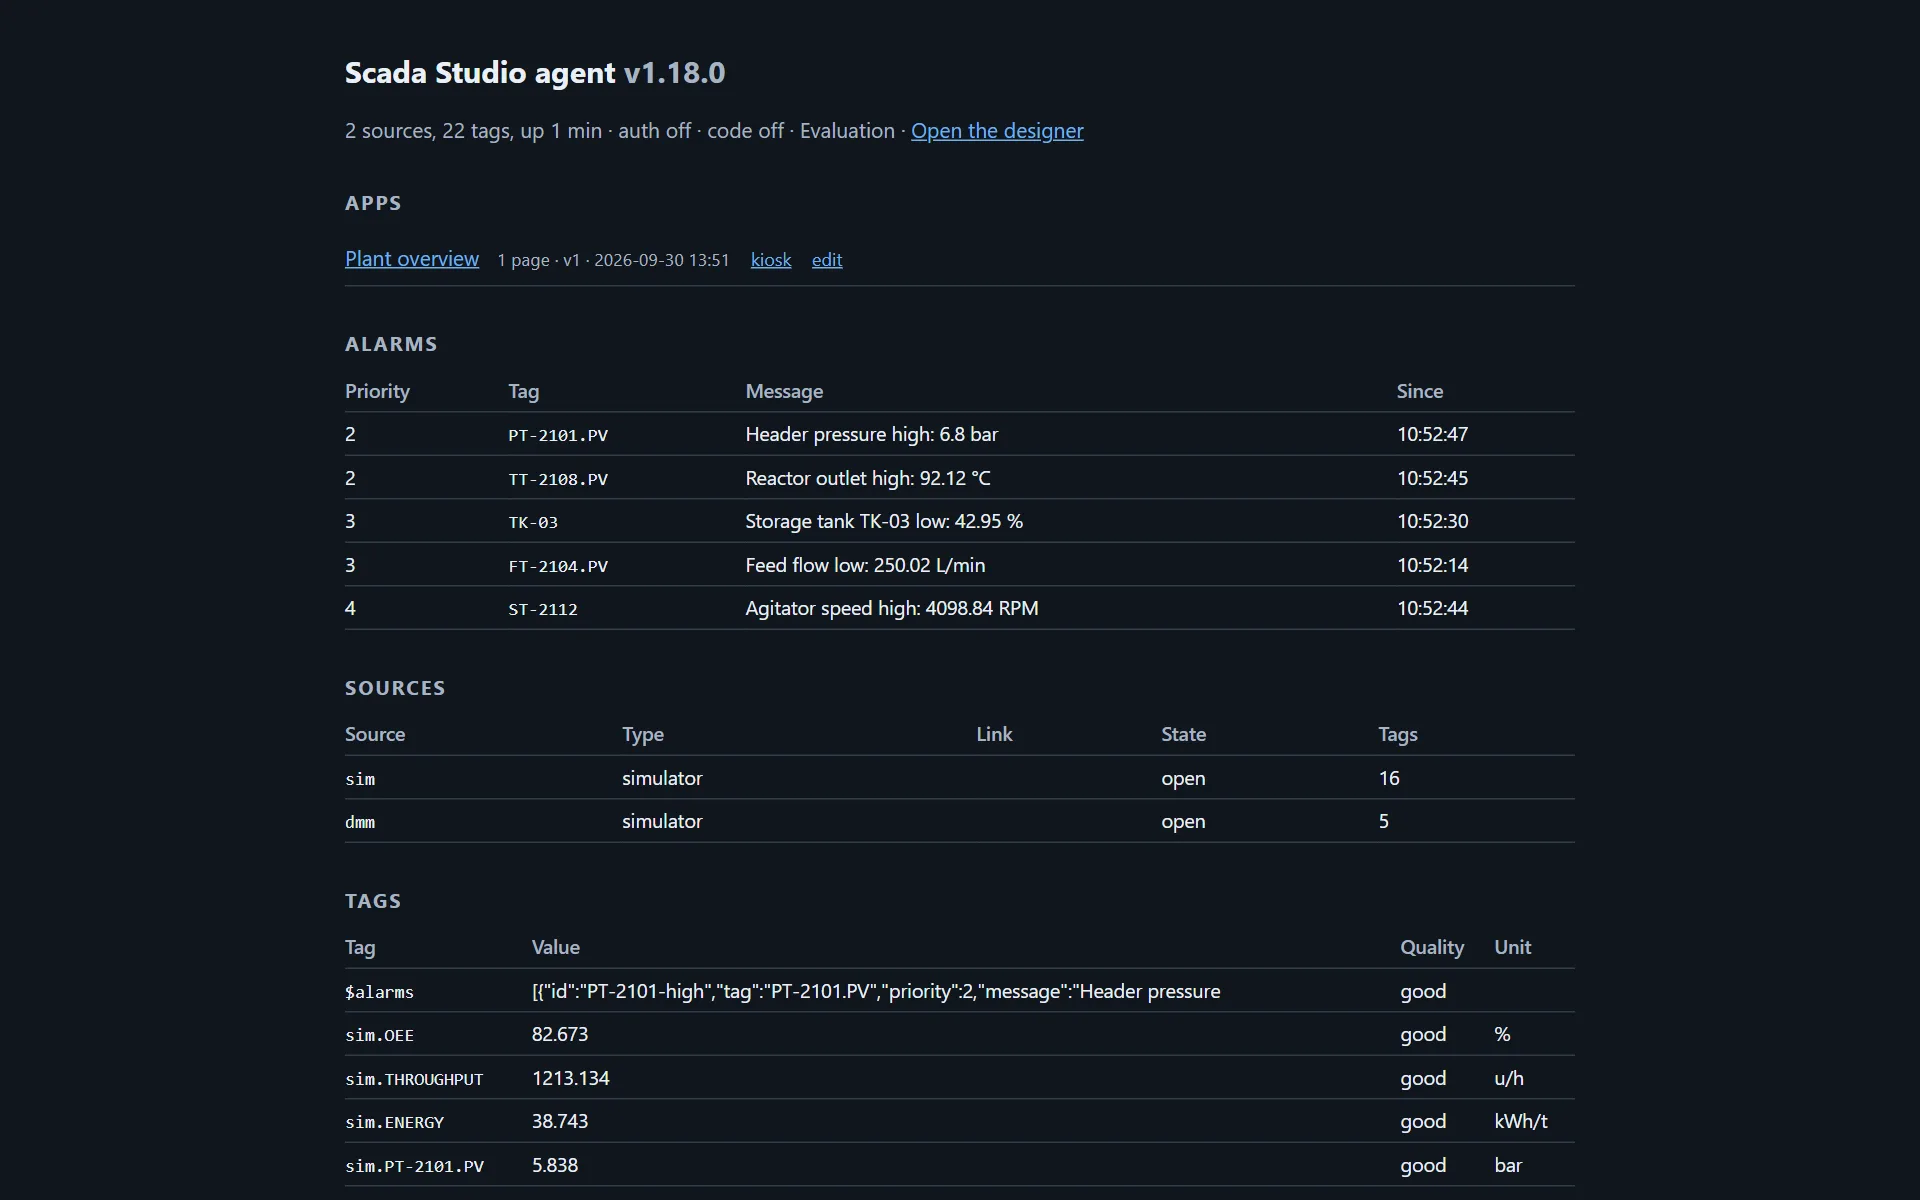
It prints its address and lists its sources. The home page at that address shows the apps, the flows and alarms, the sources with their link and state, and the tags with their latest values.
Three optional packages, installed next to the agent, add what Node.js cannot do alone:
npm install node-opcua     OPC UA
npm install serialport     native serial ports (without it, a port is opened as a file after mode or stty set the line)
npm install koffi          a vendor's VISA library for USB, GPIB and HiSLIP, and the DAQmx library
Configuration
{
  "name": "TEST-PC-07",
  "port": 8800,
  "apps": "apps",
  "logs": "logs",
  "sources": [
    { "id": "sim", "type": "simulator", "interval": 500,
      "tags": { "TT-101.PV": { "min": 60, "max": 90, "period": 60000, "unit": "°C" } } },
    { "id": "plc", "type": "modbus-tcp", "host": "10.0.0.20", "port": 502, "unitId": 1, "interval": 1000,
      "tags": {
        "TT-101.PV": { "register": 40001, "type": "int16", "scale": 0.1, "unit": "°C" },
        "TIC-101.SP": { "address": 20, "kind": "holding", "type": "uint16", "scale": 0.1, "unit": "°C", "writable": true } } },
    { "id": "dmm", "type": "visa", "resource": "TCPIP0::10.0.0.31::inst0::INSTR", "interval": 1000,
      "tags": { "VOLT": { "query": "MEAS:VOLT:DC?", "unit": "V" }, "IDN": { "query": "*IDN?", "type": "string" } } },
    { "id": "ua", "type": "opcua", "endpoint": "opc.tcp://10.0.0.40:4840", "interval": 500,
      "tags": { "TT-102.PV": { "nodeId": "ns=2;s=Temperature", "unit": "°C" }, "TIC-102.SP": { "nodeId": "ns=2;s=Setpoint", "unit": "°C", "writable": true } } },
    { "id": "mq", "type": "mqtt", "url": "mqtt://10.0.0.5:1883", "qos": 1,
      "tags": { "TT-103.PV": { "topic": "plant/line3/tt103", "path": "value", "unit": "°C" }, "TIC-103.SP": { "topic": "plant/line3/tic103/sp", "writable": true, "writeTopic": "plant/line3/tic103/sp/set" } } },
    { "id": "gw", "type": "http", "url": "http://10.0.0.9/api/values", "interval": 2000, "path": "data",
      "tags": { "TT-104.PV": { "path": "tt104.value", "unit": "°C" } } }
  ],
  "auth": { "tokens": [ { "token": "sha256$…", "name": "line 3 screens", "role": "view" } ],
            "users": [ { "name": "anna", "role": "engineer", "password": "scrypt$…" } ], "sessionHours": 12 },
  "origins": [ "https://designer.example.com" ],
  "limits": { "bodyBytes": 8388608, "requestsPerMinute": 600 },
  "flows": { "allowCode": false },
  "logs": { "folder": "logs", "maxBytes": 52428800 },
  "tls": { "cert": "cert.pem", "key": "key.pem" },
  "licence": "…",
  "smartLicense": "…"
}
Tags are named source.tag. apps and logs are folders next to the configuration (logs may also be { "folder", "maxBytes", "maxLineBytes" }: a CSV log past maxBytes, 50 MiB, is archived as <name>-<date>.csv and a new one started; a cell longer than maxLineBytes (65536) is cut and says so, so one flow cannot fill the disk by the megabyte a second); runtime points at the smart-industrial package's source folder when the agent does not run from the repository (npm install smart-industrial next to it is found on its own). origins, limits, flows.allowCode, csp and frameAncestors are the fence around the port, described under security; sessions.json, sessions.key and audit.jsonl appear next to the configuration as the agent runs (data puts them elsewhere). The source reference has every source type and its fields; agent.config.json in the folder has an example of each under examples.
Who may do what
Without auth everything is open, as on a bench, and the agent says so at start. With it, every client needs to be someone: view reads tags and the API, operate also writes tags, engineer also publishes and removes apps and reads the audit trail. A token travels as Authorization: Bearer <token> on the API and as the first message { "type": "auth", "token" } on the WebSocket - never in a URL; a user logs in at POST /api/login and gets a session token that travels the same way and survives the agent's restarts. Tokens and users are added from the command line - a token is printed once and stored as its hash, a password comes from the environment so it stays out of the shell history:
node agent.js --add-token gateway --role operate
AGENT_PASSWORD='…' node agent.js --add-user anna --role engineer
Every login, write, publish and removal is a line in audit.jsonl, hash-chained; node agent.js --audit-verify walks the chain, and an engineer reads the trail at /api/audit.
The app pages, the runtime and the designer are served without identity; an app's files are its project, readable by anyone who can open it, so a token in it may only view. An app whose agent asks for a login shows a sign-in dialog, and asks again when its session ends. See security.
Users from the company's identity provider
"auth": { "oidc": { "issuer": "https://login.example.com/realms/plant", "clientId": "scada-studio", "clientSecret": "…",
                    "roleClaim": "groups", "roles": { "plant-engineers": "engineer", "operators": "operate", "*": "view" } } }
With auth.oidc the agent's users come from Keycloak, Entra ID, Okta, Auth0, ADFS or any other OpenID Connect provider: the app's sign-in dialog offers Sign in with <issuer>, the browser goes to the provider (authorization code with PKCE, no secret needed in the browser), comes back to /api/auth/oidc/callback, and the agent verifies the id_token's signature against the provider's keys, its issuer, audience, expiry and nonce, maps the roleClaim values through roles to a role (* is the role of anyone else; no match and no * refuses the user), opens a session like any other and records the login in the trail. Register the agent at the provider with the redirect URI https://<station>:8800/api/auth/oidc/callback (publicHost in the configuration is the name the browsers reach the station by, when it is not the hostname; redirectUri sets the whole address). /api/auth/oidc says whether a provider is offered, /api/auth/oidc/login starts the flow, /api/auth/oidc/callback ends it. SAML is not spoken; Keycloak and ADFS bridge a SAML provider to OIDC. OpenID Connect is a feature of the Enterprise edition.
The historian
A station can keep what its tags were. Add history to the configuration and it records every source's samples into one file per tag under history/, next to the configuration:
"history": { "retentionDays": 30, "deadband": 0.2, "minInterval": 1000 }
Present means on. A station that says nothing about history keeps none - which is right for one whose tags a plant historian already reads through our OPC UA server, and one line for anybody who wants their own.
What it keeps. Numbers and booleans, in fixed 17-byte records - a timestamp, a value and a quality byte - in time order, one file per tag. Fixed records are what make a range query cheap: record i is at offset i x 17, so a query bisects the file with a handful of small reads and then streams the range out in one go. A text tag will not fit in eight bytes and is skipped; /api/history/stats lists which, so it is visible rather than mysterious.
What it does not keep. Every sample. A 200 ms poll of an analogue that never settles is five records a second and 1.4 MB a day for one tag, so a sample is recorded when the value moved by more than deadband, or the quality changed, or maxInterval has passed since the last one - and never more often than minInterval. The heartbeat matters: without it a trend cannot tell "unchanged" from "not recorded".
| Setting | Default | What it does |
|---|---|---|
| dir | history | Where the files go, relative to the configuration |
| retentionDays | 30 | Older records are dropped from the front of each file, every six hours |
| deadband | 0 | How far the value must move to be worth a record; 0 is any change |
| minInterval | 1000 ms | Never more often than this, unless the quality changed |
| maxInterval | 60000 ms | At least this often, so a flat line still has a heartbeat |
| tags | - | The same four, per tag, over the defaults |
Reading it back. GET /api/history?tags=plc.TT-101.PV,plc.FT-101.PV&from=<ms>&to=<ms>&max=2000 answers with { tag, value, quality, timestamp } in time order - the shape Session.history() in the components' Connect layer expects, so a trend bound to an agent source can ask for the hour before it was opened instead of starting empty. Asked for more points than max, the range is cut into buckets and each gives up its lowest and its highest at the times they happened: the count is bounded and the spikes survive, which is the opposite of what taking every tenth sample does.
GET /api/history/stats reports the tags, the records, the bytes, the oldest sample and the tags skipped for being text.
Siemens S7
{ "id": "plc", "type": "s7", "host": "10.0.0.20", "rack": 0, "slot": 1, "interval": 1000,
  "tags": {
    "TT-101.PV":  { "address": "DB1.DBD0", "type": "real", "unit": "°C" },
    "FT-101.PV":  { "area": "DB", "db": 1, "byte": 4, "type": "int16", "scale": 0.1 },
    "M-1.RUN":    { "address": "M0.0" },
    "TIC-101.SP": { "address": "DB1.DBD8", "type": "real", "writable": true },
    "V-2.OPEN":   { "address": "Q0.1", "writable": true } } }
An S7-300, 400, 1200 or 1500 is read and written in its own protocol over ISO-on-TCP, port 102, without a dependency. A tag is addressed the way the engineer already has it written down: DB1.DBX0.0 a bit, DB1.DBB0 a byte, DB1.DBW0 a word, DB1.DBD0 a double word; M0.0, MB0, MW0 and MD0 for the flags; I (or E) for the inputs and Q (or A) for the outputs. The same thing spelled out as area, db, byte and bit is easier to generate. type says how to read the bytes - bool, byte, int16, uint16 (or word), int32, uint32 (or dword) or real. Without it the address says: a bool for a bit, a byte for B, int16 for W, int32 for D; the spelled-out form reads int16. The value is raw × scale + offset.
slot is 1 for an S7-1200 or 1500 and 2 for a 300 or 400; rack is almost always 0. They are the two numbers people get wrong, so the source's state says which pair was tried when the PLC refuses the connection.
On the PLC. An S7-1200 or 1500 answers this protocol only when it is allowed to: in TIA Portal, Permit access with PUT/GET communication from remote partner on the CPU, and Optimized block access switched off on every data block the station reads - an optimised block has no fixed byte offsets to address. An S7-300 or 400 needs neither.
Reads are packed: every tag is an item of one Read Var job, as many as the negotiated PDU holds, so a PLC with forty tags answers one to three requests a poll rather than forty (fourteen items to a request at the 240-byte PDU a 300 or 1200 usually agrees); /api/status reports what the last poll took. The socket carries one request at a time, so a write made while a poll is in flight waits its turn rather than being refused.
It was written to the protocol and proved against an emulator of it - the COTP handshake, the PDU negotiation, Read Var and Write Var - and has not met a Siemens PLC; the hardware page says so rather than implying otherwise.
EtherNet/IP: Allen-Bradley Logix
{ "id": "plc", "type": "enip", "host": "10.0.0.30", "slot": 0, "interval": 1000,
  "tags": {
    "TT-101.PV":  { "address": "Tank_Temperature", "unit": "°C" },
    "FT-101.PV":  { "address": "Flow[2]", "scale": 0.1, "unit": "L/min" },
    "M-1.RUN":    { "address": "Motor_1.Running" },
    "TIC-101.SP": { "address": "Temp_Setpoint", "writable": true },
    "COUNT":      { "address": "Program:MainProgram.Cycles" } } }
A ControlLogix, CompactLogix or Micro800 is addressed by tag name - whatever it was called in Studio 5000 goes in address. A member of a structure takes a dot, an element of an array takes brackets, and a program-scoped tag takes Program:<program>.<tag>. There is no register map to keep in step, which is the nicest thing about talking to a Logix controller.
slot is where the processor sits in the chassis: 0 on a CompactLogix, often but not always 0 on a ControlLogix. It is the one number people get wrong: when the controller refuses the route, every tag goes bad with "connection failure (check the route: is the processor in the slot given?)", and /api/status shows the slot tried. A controller with the port built in takes the request unrouted - "route": false.
Reads are batched into Multiple Service Packets, so a controller with forty tags answers four requests a poll rather than forty; batchSize (12, up to 64) is how many go in one, and /api/status reports what the last poll actually took. The socket is strictly alternating - one request, one answer - so requests queue and go out in order: an operator pressing a setpoint while a poll is in flight waits a few milliseconds rather than being refused. A write says what type it is sending, taken from the type the controller answered with on the last read - or from the tag's own type when it must write before it has read.
Atomic tags only. BOOL, SINT, INT, DINT, LINT, REAL, LREAL and the unsigned kinds. A STRING or a UDT is a structure, and reading one means fetching its template from the controller first; a tag that turns out to be one is reported as such rather than shown as a wrong number. There is no implicit (Class 1) I/O either: that is the controller-to-device real-time path and the wrong tool for a screen reading forty tags a second.
It was written to the protocol and proved against an emulator of it - there is no Rockwell hardware here, and the hardware page says so rather than implying otherwise.
Recipes
A recipe is a named set of values, written into the plant in one action. "Product A" is 180 °C, 42 bar and a 90 second dwell; an operator picks it instead of typing six numbers into six fields and getting the fifth wrong. They live in recipes.json next to the configuration, so they survive a restart and can be read by whoever inherits the station.
{ "recipes": [
    { "id": "product-a", "name": "Product A", "note": "the hot one",
      "entries": [ { "tag": "plc.TIC-101.SP", "value": 180 },
                   { "tag": "plc.PIC-201.SP", "value": 42 } ] } ] }
Write one in the designer under System -> Operations, or POST /api/recipes with { name, entries }; the id comes from the name when you do not give one. The entries are checked where the recipe is written rather than where it is loaded, because a typo in a tag name should be refused by the engineer who wrote it and not discovered by the operator running it.
Loading one is an event. POST /api/recipes/<id>/apply needs the operate role, writes every entry through the station's own write path - the one that refuses a tag not declared writable, and a value of the wrong kind - and answers with what happened to each:
{ "recipe": "product-a", "name": "Product A", "by": "an operator", "at": "…",
  "applied": 1, "of": 2, "failed": [ { "tag": "plc.TT-101.PV", "error": "… is not writable" } ],
  "entries": [ … ] }
Every entry is attempted. Stopping at the first refusal would leave the plant in a state nobody chose; carrying on silently would be worse, so a recipe that half-applies answers 207 and names the half that did not. The whole application goes into the audit trail as recipe.apply with the name of whoever asked, which is what somebody will want when they ask why six setpoints moved at 14:32.
Jobs: the clock as an actor
A job is something the station does because of the clock rather than because of a person: a night setback at ten, a pump exercised every Sunday so its seals do not weld, a report stamped on the hour. Jobs live in jobs.json next to the configuration.
{ "jobs": [
    { "id": "night-setback", "name": "Night setback", "enabled": true,
      "when": { "daily": "22:00" },
      "action": { "kind": "recipe", "recipe": "night-setback" } } ] }
When. Four forms, and the first three are shorthands for the fourth:
| when | Means |
|---|---|
| { "daily": "22:00" } | every day at ten |
| { "weekly": { "days": ["sun"], "at": "03:00" } } | the days named, at that time |
| { "every": 900000 } | every fifteen minutes, counted from when the station started |
| { "cron": "0 6 * * 1-5" } | five fields: minute, hour, day of month, month, day of week |
The cron field takes *, a number, a range a-b, a list a,b, a step a-b/n or */n, and day and month names - 0 6 * * mon-fri reads better than 0 6 * * 1-5. Sunday is 0 and also 7. It is deliberately not a superset of every cron: no @reboot, L, W, # or seconds field, because each means something different on different systems and a schedule that writes into a plant is the wrong place to be clever. The designer's Job dialog reads an expression as you type it and says what it will do - "at 22:00, Monday to Friday" - using the same reader the station fires on, so the two cannot disagree.
What a job does. One of three, all of them things the station can already be asked to do:
| action | Means |
|---|---|
| { "kind": "recipe", "recipe": "night-setback" } | load that recipe |
| { "kind": "write", "tag": "plc.M-1.START", "value": true } | write one value |
| { "kind": "flow", "flow": "Shift report" } | run that diagram once, in any app published here |
A job whose clock or action cannot be read is refused when it is written, not discovered at two in the morning.
What it will not do.
It does not run late. A job due at 02:00 on a station that was switched off until 09:00 does not fire at 09:00. A setpoint written seven hours late is worse than one not written, and the station cannot know which.
It does not overlap itself. A job still running when it next falls due is skipped, and the skip is counted. A recipe applied twice at once is two writers racing for one setpoint.
It does not wait for ever. A diagram a job runs is given 60 seconds (2 for a message diagram), then stopped, and the job reports that it was stopped. A diagram built around a While loop does not finish by design: that is a service, and a service belongs in the app with runOn: "agent". Give the action "seconds" if one really needs longer.
It is local time - the station's own, including whatever its daylight saving does. A plant runs on the clock on the wall.
Reading and running them. GET /api/jobs lists each with its expression, when it last ran and how that went; POST /api/jobs/<id>/run (operate) does now what the clock would do, which is the button to press when testing one; a run whose action fails - a refused write, a diagram that is not there - answers 422 with the reason in error. Every firing is in the audit trail as job.run or job.failed. The jobs themselves are configuration and stay in jobs.json; when each last ran is history and lives beside it in jobs.state.json, so the two can be versioned separately and "when did the night setback last run" survives a restart.
An OPC UA server on the agent
"opcuaServer": { "port": 4841, "path": "/UA/ScadaStudio", "security": "none", "users": false, "writes": true }
The agent then publishes every tag of its hub - the instruments, the PLCs, the flows' values - as OPC UA variables under Objects / ScadaStudio / <source> / <tag> (with the unit as a property, the quality as the status code, the sample time as the source timestamp), so a SCADA, a historian or another agent reads the station the way it reads a PLC, and writes a writable tag through the hub. security "sign" or "signAndEncrypt" offers Basic256Sha256 with that mode and no None endpoint, the server's certificate made in the pki folder; users: true asks for the agent's users instead of anonymous access. Needs node-opcua next to the agent; a feature of the Enterprise edition.
Instruments from a template
The agent ships templates for common bench instruments (templates/scpi/*.json: a Keysight 34461A, a Rigol DM3058 and DP800, a Siglent SDG1000X, a Keithley 2400, a Tektronix TBS1000 - the tags, the ports, the notes from the programming guides). In the designer's Sources dialog, an agent source has an instrument row: pick the template, give an id and the address, Add to the agent - the agent starts it, writes it into its configuration file and records it in the trail; Fetch the agent's tags then lists its tags. The same by hand: POST /api/sources with { "template": "keysight-34461a", "id": "dmm", "host": "10.0.0.31" }. Next to each template the dialog says what the hardware page says of its path: verified on a device, verified against the emulator, or beta.
The station's licence
node agent.js --activation-request prints this station's activation request - its fingerprint (the host name and the first hardware address, hashed; nothing else leaves the machine) with a few plain facts. Send it to your supplier by any means; the station token that comes back goes into "licence" in the configuration and is valid on this station. Nothing calls anywhere: activation is a file each way. The licensing page has the editions and what each allows; /api/status shows the edition, the features it refuses, the fingerprint and the build date.
TLS
node agent.js --make-cert --host station-7,10.0.0.7 cert.pem and key.pem next to the configuration
then "tls": { "cert": "cert.pem", "key": "key.pem" } in the configuration: the agent speaks HTTPS and WSS on its port, and an app's agent source with an https:// address connects over wss://. A plant with its own certificate authority puts its certificate and key in the same fields.
Flows and logs
A published project's flows with runOn: "agent" run here from the moment of publishing and again at every start. /api/flows lists them with message counts and errors (a Notify post that failed, a tag the station does not have); /api/alarms the alarms they raised; /api/logs the files they wrote. A CSV log has a header from the first record's fields; a TDMS log has one segment per second, a channel per field, and file properties naming the agent and the app, for any tool that reads TDMS, npTDMS among them. The flows guide says what the nodes do on the agent.
Running at boot
node agent.js --install --dry-run     shows what would be done
node agent.js --install               Windows: a service ScadaStudioAgent through WinSW when winsw.exe is next to the agent,
                                      else a scheduled task at system start, as SYSTEM, that never times out and restarts on failure
                                      Linux: a systemd unit scada-studio-agent, enabled and started
node agent.js --uninstall
Both take the --config and --port they were given. Node.js is not a service host of its own, and the agent takes no dependency for one: systemd is there already, and on Windows WinSW (MIT) turns any program into a service - put winsw.exe next to agent.js (or name it with --winsw) and --install writes the service definition, installs and starts it, with the output rolled into log files and start and stop in the Event Log. /healthz and /metrics are there for a watchdog and for Prometheus.
Where it runs
Windows 10 and 11 and Windows Server, Linux (Debian, Ubuntu, RHEL and their relatives, including ARM boards), macOS; Node.js 18, 20, 22 and 24. One agent serves one station's equipment; a plant has one per station, and a project may use several agent sources.
The API
Every route is in the API reference. The ones you will use by hand: /api/status, /api/tags, /api/flows, /api/logs.