Guides
Message flows
On this page · 6 sections
A flow is nodes and wires. A node receives a message, does one thing, and sends messages out of its output ports; the wires carry them to the next nodes. A flow runs either in the browser, with the page, where it can read and set the components, or on the agent, on the station, whether a browser is open or not. This page is about message flows; a project's flows can also be dataflow diagrams, which compute rather than react, and the + next to the diagram list in the top bar asks which kind you want.
The message
Every message has the same shape, whatever produced it:
{ "topic": "sim.TT-2108.PV", "payload": 92.4, "unit": "°C", "quality": "good", "timestamp": 1758361600000 }
topic says what it is about (a tag, a component, a name you gave); payload is the value - a number, a boolean, a text, a record or a list; unit travels with it and the Units and Math nodes keep it right; quality comes from the source; timestamp is when the sample was taken. The wire's colour in the editor is the kind of the last payload that passed: orange for a number, green for a boolean, pink for text, brown for a record.
Messages are delivered through a queue and copied for every wire, so a node never recurses into itself and two branches never share an object.
The editor
Diagram in the top bar switches the canvas; the + next to the diagram list offers a message flow as the second kind. The palette lists the 26 node types by category as icon tiles; click one or drag it onto the canvas. Wire by dragging from a node's output terminal (right) to another node's input terminal (left); a node with several terminals names them. Select a node to set its fields in the inspector - a tag picker, a component picker with the component's events and properties, a code editor for the Function node. Select a wire and press Delete to remove it. A tag dragged from the bar onto the canvas becomes a Tag node.
With nothing selected, the inspector holds the flow itself: its name, whether it runs in the browser or on the agent, whether it is enabled, a description, and its counts while it runs.
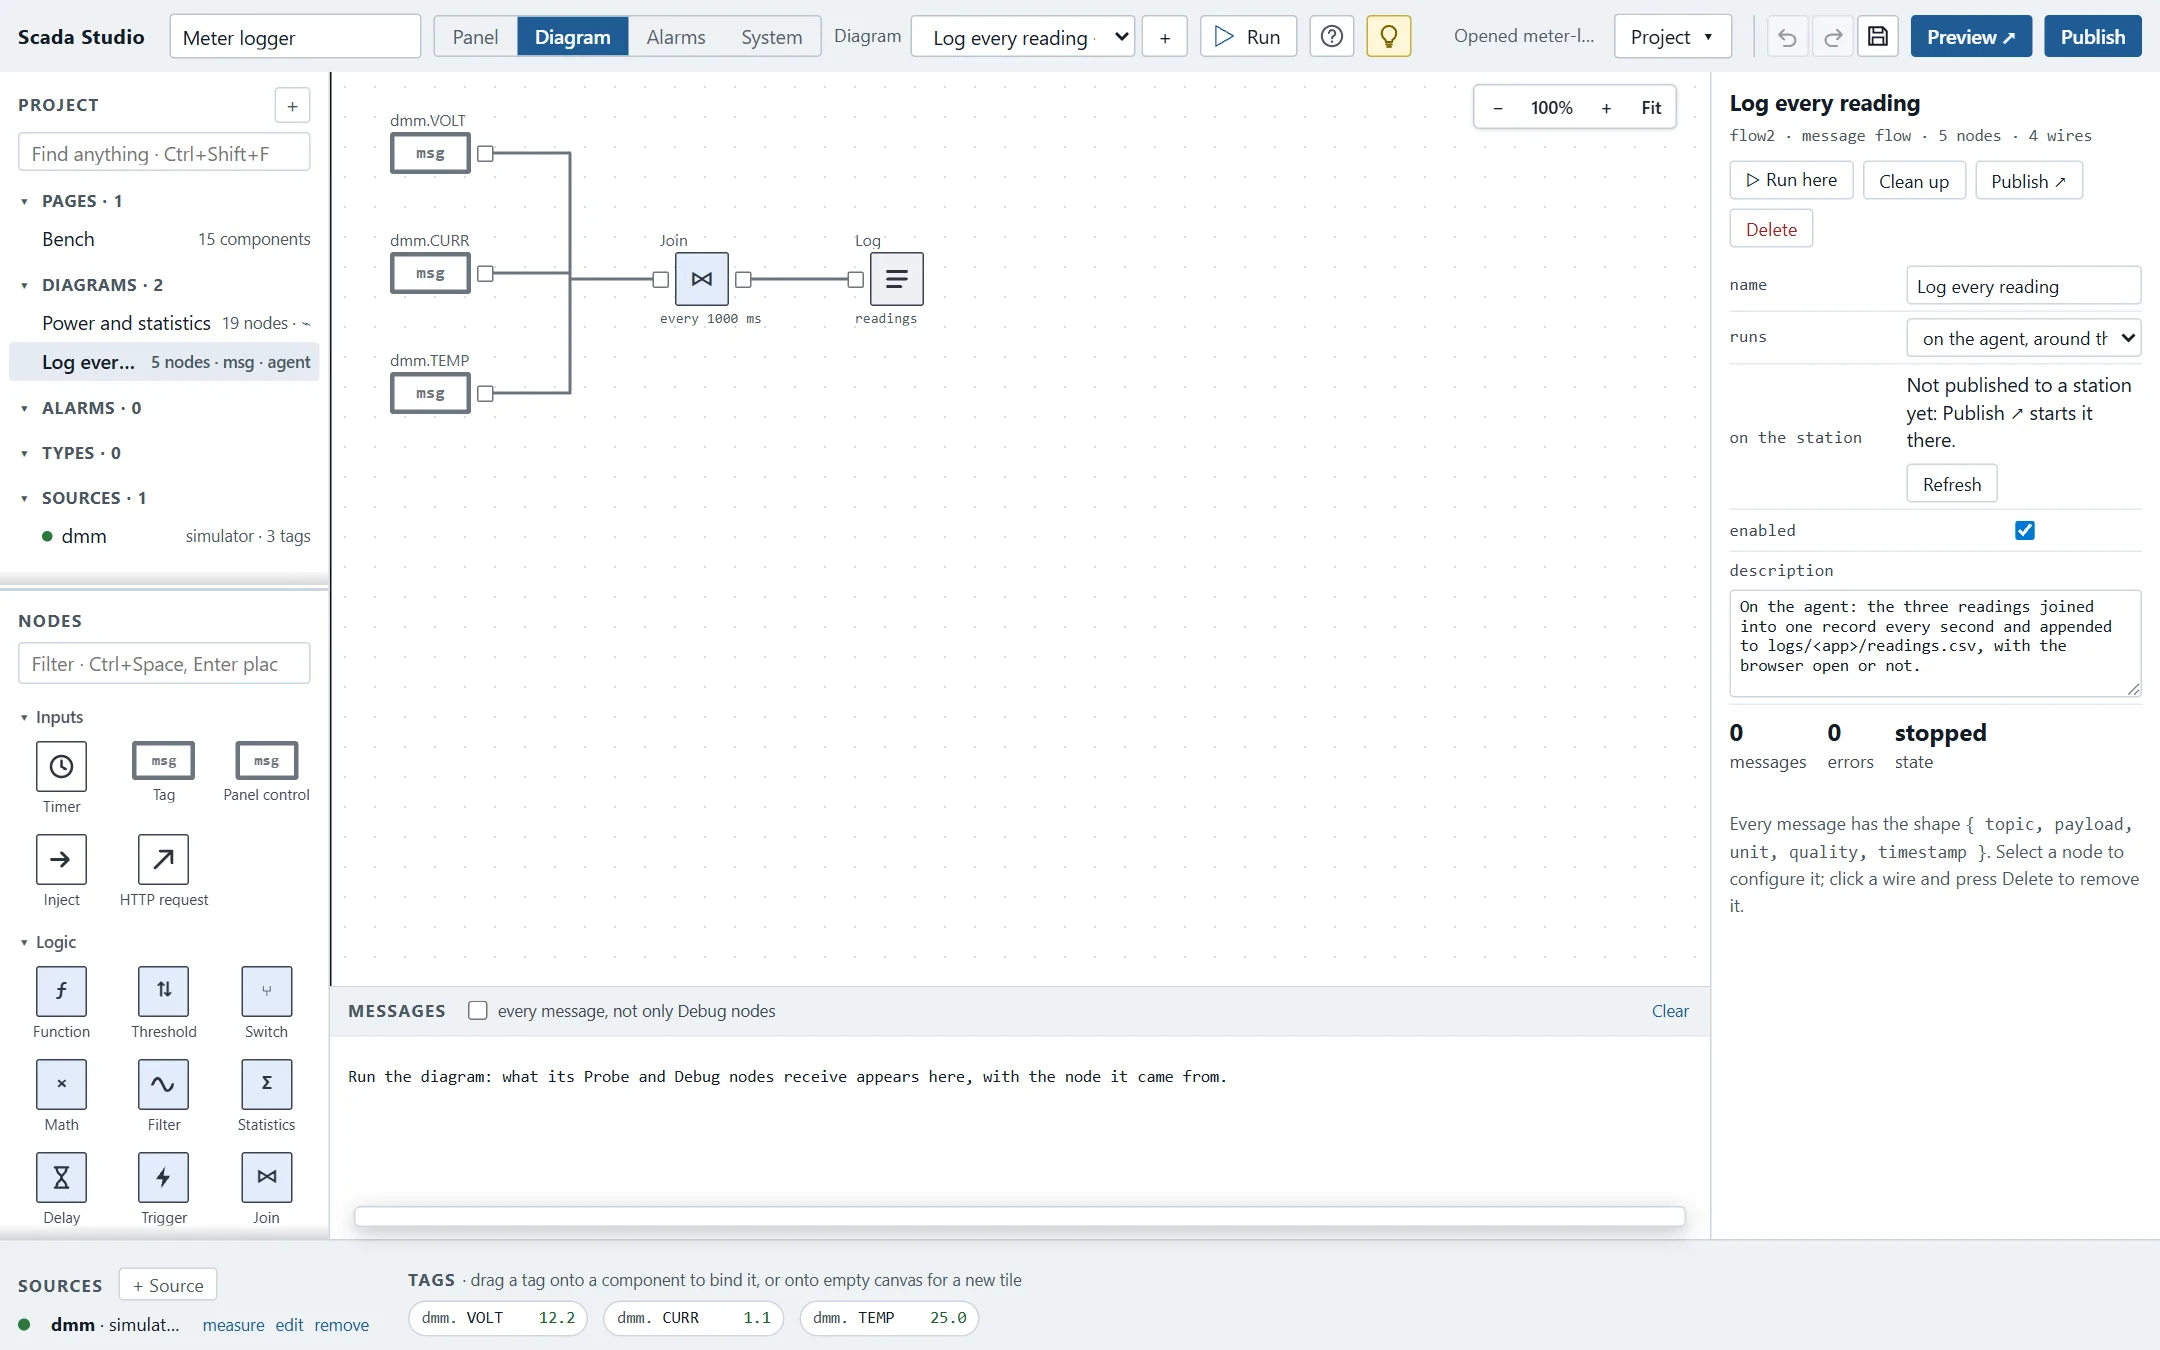
Running here
▶ Run runs the selected flow in the designer, against the project's sources and the pages it has rendered. Every node shows its last payload; the strip under the canvas shows the messages the Debug nodes receive (or every message, with the box ticked), and a Log node's rows can be downloaded as CSV from the strip. An Inject node has a ▶ of its own to send its message on demand. A change to a node restarts the flow, so what you see is always the flow as it is.
Running on the agent
A flow marked on the agent starts on the station the moment the project is published, and again whenever the agent starts. There, Tag nodes read the agent's own tags (agent.plc.TT-101.PV is the agent's plc.TT-101.PV), a project's simulator sources run on the agent for the app, Device write nodes write through the drivers, and:
- a Device write to agent.flows.<name> publishes a value as a tag the pages can bind to;
- the Alarm node keeps the agent's alarm list, published as the tag agent.$alarms - bind an alarm banner's alarms property to it;
- the Log node appends logs/<app>/<name>.csv, or a TDMS file with format: tdms;
- Panel nodes do nothing, since there is no page.
The agent's home page and /api/flows show what runs, with message counts and the last errors - among them a Notify whose post failed (no answer, or an answer other than 2xx) and a Tag node naming a tag the station does not have, which gives its default. In the designer a Notify that failed is marked on the node and written in the strip.
Patterns
- An alarm with hysteresis: Tag → Threshold (> 92, clears at 90) → Alarm, with the Threshold's crossed output on the Alarm's raise input and cleared on clear.
- A derived value on the screen: Tag → Math (x * 9 / 5 + 32, unit °F) → Panel indicator.
- Two tags into one: two Tags → Join (a record keyed by topic) → Function (msg.payload = msg.payload['dmm.VOLT'] * msg.payload['dmm.CURR']) → Panel indicator.
- A button that commands an instrument: Panel control (a momentary button's press) → Change (payload "OUTP ON") → Device write.
- A log every second, on the station: Tags → Join (every 1000 ms) → Log (readings, tdms), on the agent.
- A webhook when something is wrong: Threshold → Template ({{topic}} is {{payload}} {{unit}}) → Notify.
The node reference lists every node with its fields. The sample Meter logger is the patterns above in one project.
Limits worth knowing
A Math node's expression is read by the formula language, not run as code: x is the payload as a number and msg the whole message (msg.payload.active ? 3 : 2), and that covers most of what a line of code used to. A Function node runs the JavaScript you give it with the message as msg and a store that survives between messages; it is code, and a station runs it only when its configuration allows code, then in a sandbox thread with a time limit - the security page says what that means. Flows in the browser stop when the page closes; anything that must keep running belongs on the agent. Subflows and a library of your own nodes are not there yet. What is computed rather than reacted to - engineering units from counts, a running mean, an acquisition of N samples - reads better as a diagram.