Guides
Dataflow diagrams
On this page · 12 sections
A dataflow diagram is the second kind of flow. Where a message flow reacts to events - a sample arrives, a threshold fires, an alarm is raised - a diagram is a program: it reads, computes and writes, and a loop frame does that again and again. If you have written graphical dataflow, this is the block diagram; if you have not, it is a spreadsheet whose cells are nodes and whose formulas are wires.
The rules
- A wire carries one value of one type. Terminals are typed - number (orange), boolean (green), text (pink), array (violet), record (brown) or any (grey) - and a wire only goes between terminals of the same type, or to and from any. The editor refuses the others and says why.
- An input takes one wire. Wiring a second replaces the first, and the status line says which wire went - from another case of a Case frame too, where the way to give one value out of either case is an output tunnel. An input without a wire uses its default, shown in the reference. A frame's own terminals that are read before it runs - a Case's selector, a loop's count and period - cannot be wired from inside it; nor can what a frame gives when it has run - a For loop's array, a Case's output tunnel - feed its own body, which would be a wire loop. A frame's own inner terminal may feed its loop terminal: i wired to collect gives the array 0 … N-1.
- Numbers are IEEE numbers. A number divided by zero gives Infinity (or -Infinity), zero divided by zero gives NaN - the Divide node and the Formula node agree - and both travel down the wires as they would in graphical dataflow: NaN + 1 is NaN, NaN = NaN is false, and a comparison against NaN is false. A text that is not a number reaching a number terminal is NaN too; nothing, an array or a record is the terminal's default.
- A node runs when its inputs have values, once, from the sources of the diagram to its sinks. There is no order to write down: the wires are the order.
- A loop is a frame. A While loop or a For loop is a node with a rectangle; the nodes placed inside the rectangle are its body and run once per iteration, the nodes outside run once. A value wired into the frame from outside is read at the loop's start; a value wired out is delivered when the loop ends. Move the frame and its body moves with it; move a node in or out and it changes sides. A frame is inside another only when it lies wholly inside it: one dropped half over another is in neither, and the status line says so.
- Feedback carries a value across iterations. A Feedback node gives out what it was given in the previous iteration (its initial value on the first), so a running sum, a filter, a count or the last N samples can be built without a wire loop; a Feedback inside a Case, Event or Sequence of the loop latches with the loop. Any other wire loop is an error the diagram reports.
- A Case frame runs one of its cases, chosen by its selector; a Subdiagram node calls another diagram of the project as one node.
- A diagram without a loop runs once and finishes: the run arrow returns, what the run held (tag subscriptions, panel listeners) is released, and the values stay in the nodes' bubbles. A diagram with a loop runs until its stop terminal, or Abort.
- Every node shows its last outputs on the canvas while the diagram runs; a Probe puts a value in the message strip as well.
The look
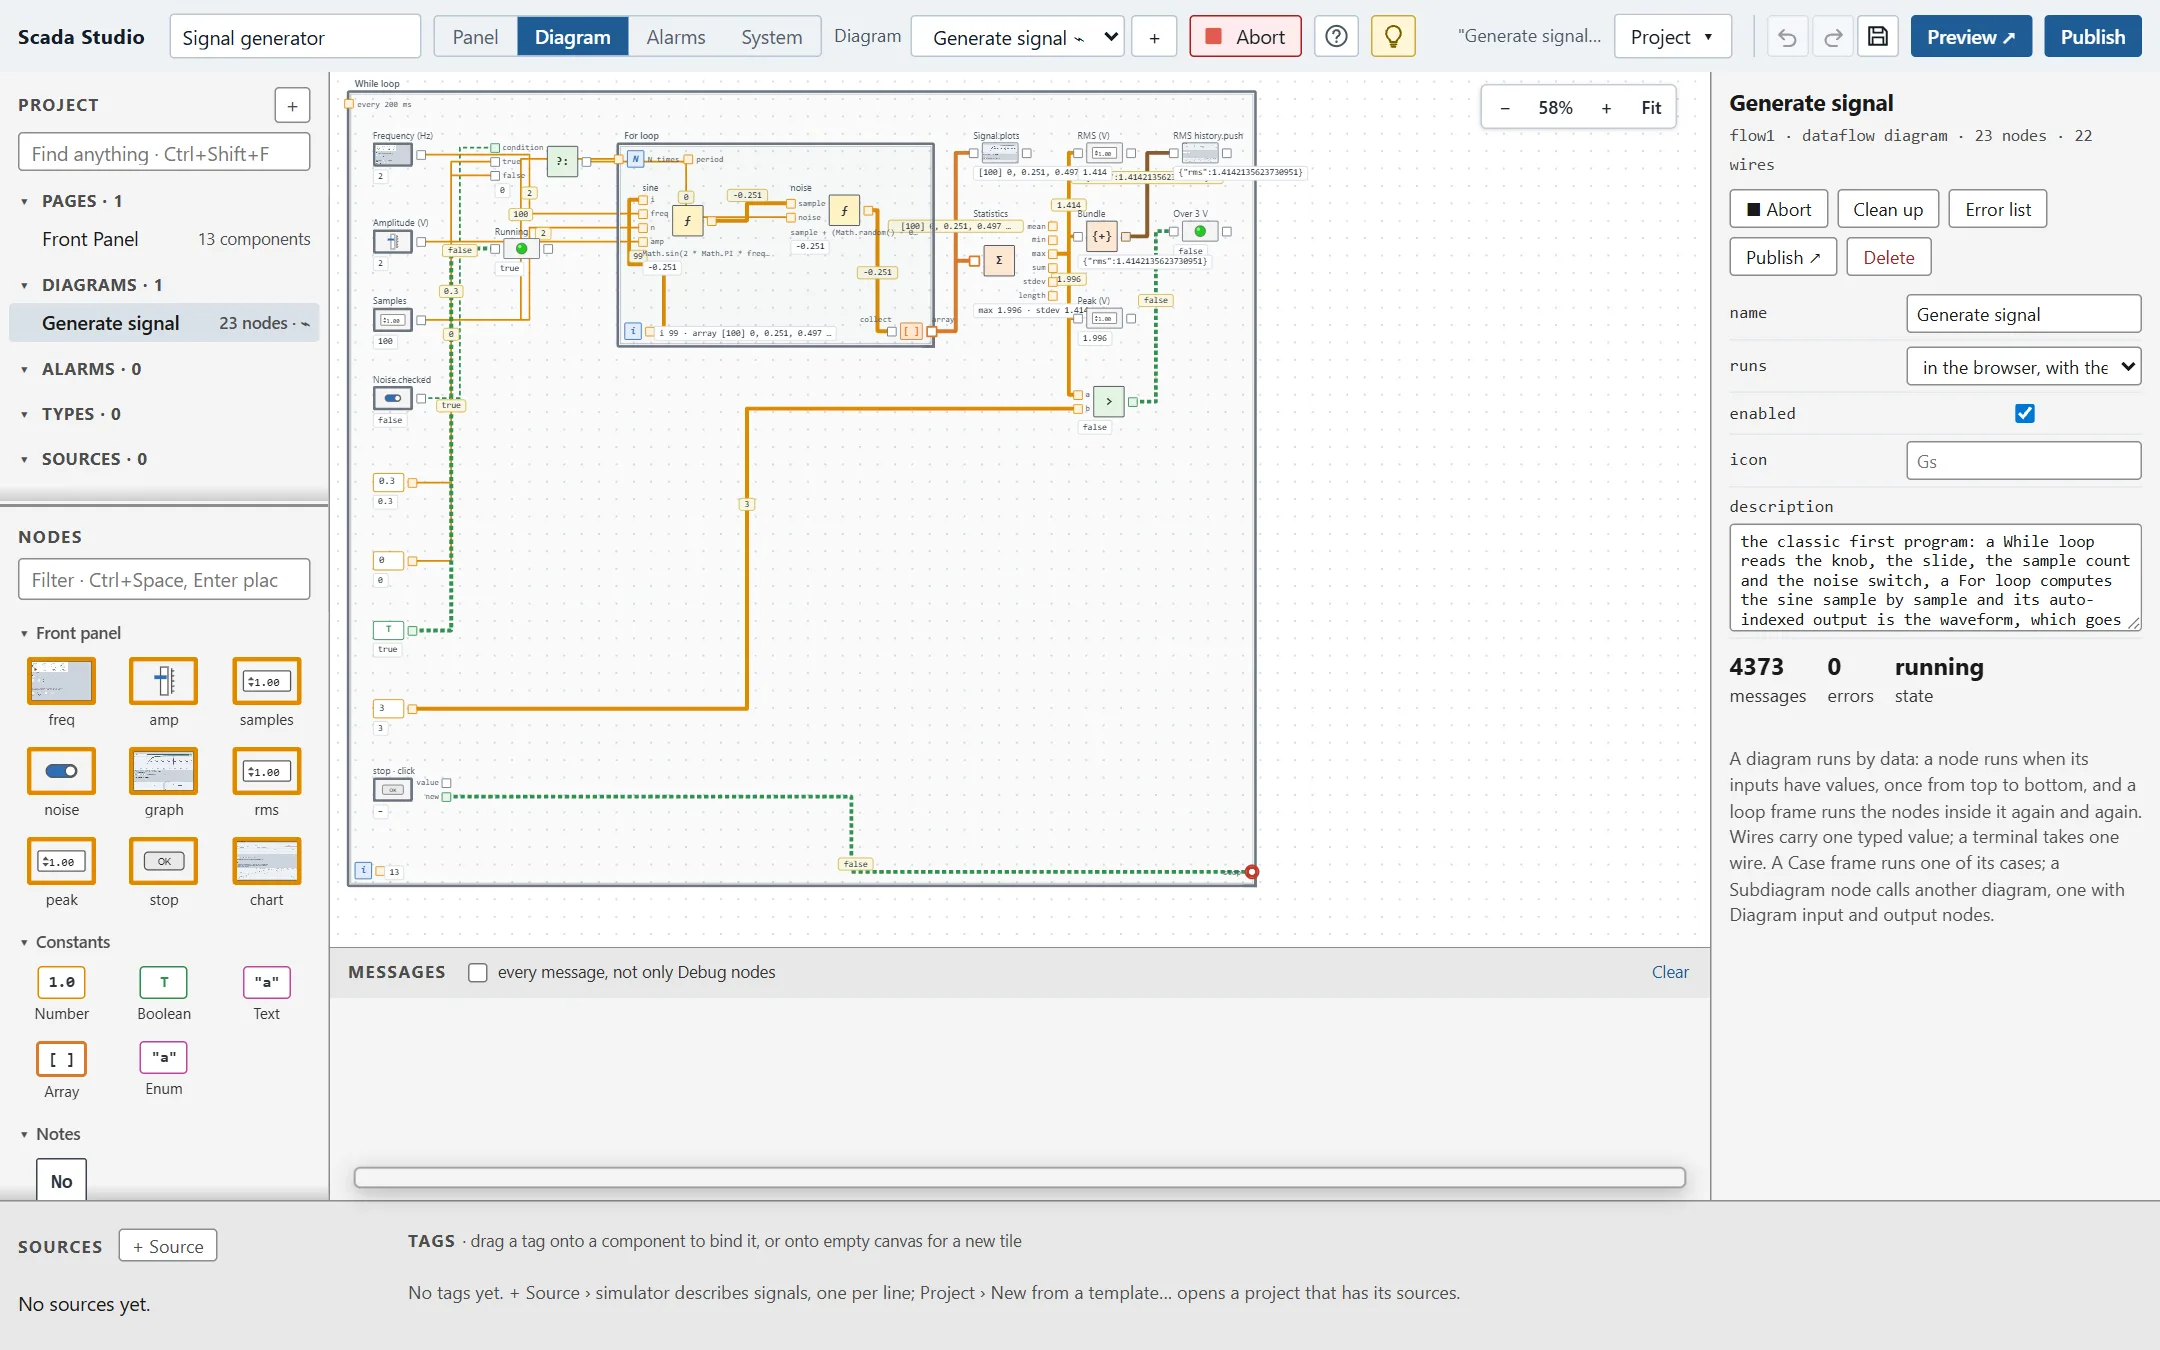
The diagram is drawn the way a block diagram is read. The canvas is white with a dot grid. A function is a small square with a glyph, tinted by its family - yellow for maths, green for comparison and logic, pink for text, orange for arrays, blue for time - with its terminals as small squares on its edges, named on the side that has more than one; its name sits above it, its setting (a formula, a window size) below. A constant is its value in a box bordered in the type's colour. A terminal - a tag, a front-panel object, a diagram's own input or output - is a box with the type's abbreviation: DBL for a number, TF for a boolean, abc for text, [ ] an array, { } a record, var for any; a thick border gives a value (a Tag, a Panel value, a Panel control, a Diagram input), a thin one takes it (Write tag, Panel indicator, Diagram output). Wires run in straight lines with right angles and carry the type's colour: orange numbers, green dashed booleans, pink dotted text, thick orange arrays, brown records. A loop is a frame with a thick grey border, its iteration terminal i at the bottom-left, the stop terminal (a red ring) at the bottom-right, the count N or the period at the top-left; a Case has its selector ? on the left edge and the case name between ◀ and ▶ on the top edge; an Event frame has a double border and the bolt with the event it waits for at its top-left. A Subdiagram node shows the initials of the diagram it calls. A front-panel terminal shows its control's picture in the box - the classic icon terminals - so a knob's terminal looks like a knob; the type stays in the tooltip.
A wire is drawn from an output to an input or, the other way round, from an input back to an output; let go on a node rather than on its terminal, it takes the node's first free input of a type that fits (from an input, the node's first output that fits). A wire, a node or a marquee dragged near the canvas's edge scrolls the canvas that way. Several nodes select by shift-click, by a marquee drawn on empty canvas, or all at once with Ctrl+A; a drag on one of them moves them together (a frame always takes what is inside it), the arrow keys nudge them, Delete removes them with their wires, and Duplicate copies them with the wires between them - a frame with everything in it, beside the original where the copy covers nothing, so it takes in no node that was there. Clean up (in the diagram's inspector, or Ctrl+U) lays the whole diagram out by its wires: every node one column to the right of what feeds it, the columns ordered to cross as few wires as it can, frames grown to hold their body - the classic Clean Up Diagram; a diagram's input and output nodes keep their order down a column, so the Subdiagram nodes that call it keep theirs. A wire selected is a probe: the inspector names its ends, its type and the last value that passed. Context help (the ? in the top bar, or Ctrl+H) opens the classic small window in the canvas's corner: the node under the pointer, what it does, and its terminals with their types, the wired ones in bold. Ctrl+E switches between the panel and the diagram, Ctrl+R runs, Ctrl+. aborts.
Breakpoints and stepping. Alt+click a node (or tick breakpoint in its inspector) and a red dot marks it: the diagram pauses before that node runs, the node pulses red, and a strip over the top of the diagram offers Step (F8: run this node and pause at the next, whatever it is) and Continue (F5: run on to the next breakpoint). The values already computed stand in the nodes' bubbles while it waits; Abort ends a paused run. Breakpoints are kept in the project, as graphical tools keep them in the VI. Quick Drop (Ctrl+Space): type a node's name in the palette filter and Enter places the first match. A node placed this way, or by a click on a palette tile, goes where you are looking: into the frame under the middle of the view when there is one (the innermost with room in sight), else onto free canvas in sight. While a diagram runs, every node shows its last value in a bubble under it (a node with many outputs names only the wired ones) and the wires pulse as values pass; the lightbulb in the top bar turns on execution highlighting, which writes the values on the wires themselves. The run arrow runs the diagram here and becomes the red Abort square while it runs; it breaks when the last run reported errors. The Front panel group at the top of the palette holds a terminal for every component of the page - drop one on the canvas and it is bound to that component, as a control (its request event) or an indicator (its value), the way a front-panel object's terminal appears on a classic diagram.
The broken arrow and the Error list. The diagram is checked every time it is drawn, as a graphical language checks a program before it runs: a wire loop without a Feedback node (a For loop's array or a Case's tunnel wired back into the frame's own body is one), a wire to a terminal that is gone (the fields of a Bundle or a Formula changed) or of the wrong type, a frame's selector, count or period wired from inside it, a node that names nothing (a Tag without a tag, a Panel node without a component, a Subdiagram without a diagram, or one calling itself), a Formula that does not compile. Any of these breaks the run arrow: the diagram does not run, and the arrow (or Run, or Ctrl+R) opens the Error list - each line says what is wrong and where, and clicking it selects the node or the wire, turning a Case frame to the case it is in. A broken wire is drawn red and dashed. A wire between two cases, a Case whose cases do not cover a boolean selector (true and false, or default; a number or text selector needs a default), a Subdiagram whose diagram has errors of its own or calls back, and a Formula terminal that is not a JavaScript name are errors too. Warnings - a tag no source of the project has, a Feedback outside a loop, a Case whose selector is not wired, a diagram called that has no terminals yet - are listed too, and the diagram runs with them; the Error list button in the inspector opens the list when only warnings are there. Find (Ctrl+F) looks through the nodes' names, types and settings: Enter goes to the next match, Shift+Enter to the previous, Escape closes.
The right-click menu. As in graphical dataflow, most of the diagram's editing is on the shortcut menu. On a terminal: Create constant (a constant of the terminal's type, wired to it, with the terminal's default), Create control on the panel (a control of the type from the controls palette - numeric, toggle switch, string - placed on the current page with the terminal's name as its label, and a Panel value node wired to the terminal), Create indicator on the panel on an output (a numeric indicator, an LED, a string indicator, or a waveform graph for an array, with a Panel indicator node wired from the output), and Delete wire. On a wire: Insert - a node of the wire's type goes into it (Math, Compare, Text, Arrays…) - and Delete wire. On a node: Replace with (another node of its category; each wire stays on the new node's terminal of the same name where its type fits, and the others are removed, the status line naming them), Duplicate, Copy, the breakpoint, Help, Delete; on a Case or Sequence frame also Show case, Add a case after this one and Remove this case. On the canvas: Paste, Select all, Clean up, the Error list and the context help.
Copy and paste. Ctrl+C copies the selection - a frame with everything inside it - and the wires between the copied nodes; Ctrl+V pastes it 30px off (or where the menu was opened), into this diagram or another of the same kind, in this project or another: the copy is text on the clipboard. A selection holding a frame goes to the nearest place where it covers nothing - into a frame it lies wholly inside, if that is where it was pasted - so it takes in no node that was there. Ctrl+Z undoes, Ctrl+Y (or Ctrl+Shift+Z) redoes, on both sides of the designer; on the diagram side, a step taken on another diagram than the one shown - a subdiagram edited, then its caller opened - shows that diagram.
The frames
A While loop runs every period milliseconds (a terminal, or the field) until its stop terminal - wired from inside, on the frame's right edge - is true, or the diagram stops. i is the iteration, from 0, available inside. A For loop runs count times (N), and auto-indexes: what is wired to its collect terminal on the right edge, from inside, is gathered one value per iteration into the array the loop gives out when it ends - the way a classic For loop's output tunnel builds an array. A loop without a period runs flat out and lets the page breathe every 64 iterations. A screen that reads the plant every half second is one While loop with a Tag, some arithmetic and a Panel indicator inside; an acquisition of a hundred samples is a For loop with a Tag and an Append inside and Statistics after it.
Events
An Event frame is the event structure: it names a component of the page and one of its events (a setpoint, a press, a selection) and waits for it; when the event fires, the nodes inside the frame run once with the event's value at the frame's value terminal. Inside a While loop it handles one event per iteration - the loop then runs at the pace of the operator, not of a period - which is the graphical dataflow pattern for a user interface: a While loop around an Event structure. A timeout (a terminal or the field, in milliseconds) makes it give up waiting and run with timedOut true; without one it waits as long as the diagram runs. On the agent there is no panel to raise events: an Event frame there times out, or reports an error when it has no timeout.
Sequences
A Sequence frame is the flat sequence structure: its frames field says how many frames it has, the frame shows one at a time (◀ ▶ on its top edge, frame 1/3), and when the sequence runs, everything in frame 1 runs, then everything in frame 2, and so on. It is for what must happen in an order the wires do not give - set up an instrument, then measure, then close - and for nothing else: where a wire can carry the order, the wire is better. Its frame output is the number of the frame running. Wires may come in from outside and leave to the outside; a wire between two frames is refused.
Cases
A Case frame is the case structure: it has a selector terminal and a list of case names in its cases field - true,false for a boolean selector, 0,1,2,default for a number, running,stopped,default for a text - and it runs the case named like the selector's value, or the case named default; a selector no case is named after, with no default, is an error the run reports (a graphical language refuses to run such a case structure). Removing a Case frame keeps the case it shows and takes the other cases with it, as the classic Remove Case Structure does. The frame shows one case at a time: its head has ◀ and ▶ to turn the cases, and the nodes you place inside belong to the case shown. A node dragged out of the frame leaves its case; one dragged in joins the case shown. Editing the cases field keeps each node with its case by name: reordered, the cases keep their nodes, and so does a name changed in its place; the nodes of a case taken out go to the first case, and the status line says so (Ctrl+Z puts them back). A wire may come into a case from outside, and go out of it to a node outside; a wire between two cases is refused, because only one of them runs. When a case that has an outgoing wire does not run, the node at the other end gets its terminal's default - as a classic output tunnel does with use default if unwired. The frame's case output is the name of the case that ran.
A Case frame can also give a value out: its output tunnels field names them, and each becomes a tunnel on the frame's right edge - a hollow square on the border with a terminal inside, that every case wires from its own nodes, and a terminal outside, that the diagram reads. Only one wire per case goes into a tunnel; a case that wires nothing gives null, and the check says so. This is the classic output tunnel, and it is how a state machine is built: a Feedback node holds the state, the Case runs the state's case, and each case hands the next state out through the tunnel back to the Feedback node.
Use it for what must happen only sometimes: a Write tag in the true case of a comparison, an Alarm per band of a value, a different Panel indicator per state of a machine. The sample plant overview's Agitator watch sets the stack light to running in its true case and to warning in its false case, where it probes the speed as well.
Subdiagrams
A diagram becomes callable by giving it terminals: a Diagram input node for each value it takes (a name, a type, a default) and a Diagram output node for each value it gives. Another diagram then calls it through a Subdiagram node whose left terminals are the inputs, top to bottom as they are placed in the callee, and whose right terminals are the outputs. The callers' wires follow the terminals by name: moving an input above another, renaming one or cleaning the callee up re-points the wires of every Subdiagram node that calls it, in the same undo step, and a wire whose terminal was removed breaks, where the caller's Error list shows it. The call runs the callee once, from its inputs to its outputs, and returns; inside a loop it runs every iteration. A diagram with terminals does not run on its own - not with the page, not on the agent - only when called; ▶ Run in the designer runs it once with the terminals' defaults, which is how you test it. The flow list marks it sub; its inspector names the diagrams that call it.
A subdiagram runs wherever its caller runs, in the browser or on the agent, so it may not use Panel nodes if a caller is on the agent. It may call other subdiagrams; a diagram calling itself, directly or through others, stops at a depth of eight with an error. The sample's Percent of band takes x, low and high and gives percent; the Agitator watch calls it with the speed and the band.
Records
A Bundle node makes a record from its inputs, one field per name in its names field - the terminals follow the names - and Unbundle takes the fields out again. A Tag node's value, quality and timestamp are separate terminals, but a record travels as one value: bundle a reading with its unit and its time, pass it through a subdiagram as one terminal, or push it to a chart from a Panel indicator (a record with timestamp is what a chart's push takes).
Nodes
60 node types in eleven categories, in the diagram node reference: constants (a number, a boolean, a text, an array, an Enum - one of a list of names, for the states of a machine); a Note, the classic free label; Tag and Write tag; Panel value, Panel indicator and Panel control; arithmetic, Function, Scale, Clamp, Round and Formula (the classic formula node: its inputs and outputs fields name the terminals, one line is an expression of the inputs, several lines assign the outputs, declaring what else they need - let band = high - low; pct = (x - low) / band * 100;); comparisons, And/Or/Not, Select, Changed; text; arrays with Append (keep the last N) and Statistics, Bundle and Unbundle; Now, Elapsed and Wait; the loops, Feedback, Case, the diagram terminals and Subdiagram; Probe, Alarm, Log and Notify.
Patterns
+ next to the diagram list offers, besides a blank diagram, the classic design patterns as a start: Acquire, analyse, display (a While loop reads a tag every 500 ms, keeps the last 50 readings through a Feedback node, shows the value, the mean and the peak), State machine (the Feedback-and-Case pattern above, with idle, running and done states), Event handler (a While loop around an Event frame with a timeout: choose the component and the event) and Measurement loop (a For loop computes 100 samples of a formula and auto-indexes them into an array for Statistics). Each comes laid out and running; the description in the inspector says what it does. With several nodes selected, the inspector's align tools line them up or distribute them, as the panel's do - a frame among them takes what is inside it along; a wire's tooltip says where it goes and what passed last.
Running
A diagram runs where a message flow does: ▶ Run in the designer, with the page when the app opens, or on the agent from the moment the project is published (runOn: "agent", with Panel nodes doing nothing there and a Write tag to agent.flows.<name> publishing a value the pages bind to). The sample plant overview has one: Agitator watch reads the agitator speed every half second, checks it against a band, and sets the stack light.
When to use which
A message flow for what happens: alarms, logging on change, a button that sends a command, a threshold with hysteresis. A diagram for what is computed: engineering units from counts, a running mean, a value from several tags at once, an acquisition. They live side by side in one project and both see the same tags and components.