Advanced Data Visualization with Grid ChartingSmart.Chart integration with Smart.GridThe next version of Smart Web Components will bring integrated charting functionality that allows users to chart directly inside the Grid Web Component. We are happy to announce that Smart Grid is the First Enterprise Grid with such feature available. The charting is implemented through our Smart.Chart Web Component and is using the grid data source. Charts can be exported to .PDF, .PNG of .JPEG. There are two approaches to create a Chart.
Smart.ChartThe charting used in the Grid and Chart integration is our own-made Smart.Chart component. Smart.Chart is a Web Component built through the Smart Framework and is based on the broadly used jQWidgets Charting solution. It does not have any third-party dependencies. It is created by our own Team as all other UI components in our package. 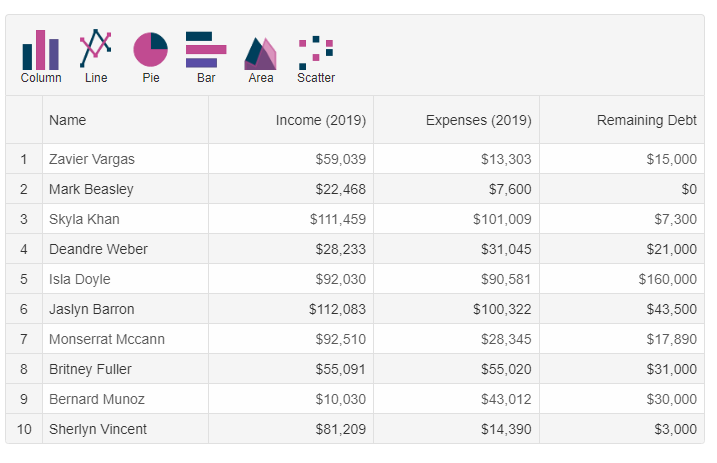
Chart ToolbarThe Toolbar with Charting options is displayed in the Grid header. By clicking a Chart Type, the Grid will create it. To create Charts, users will need to import the Smart.Grid, Smart.Chart and Smart.Window modules and enable the Charting in the Grid. Below is displayed a Chart created through selection by dragging or by keyboard navigation a Cells Range of Numeric values.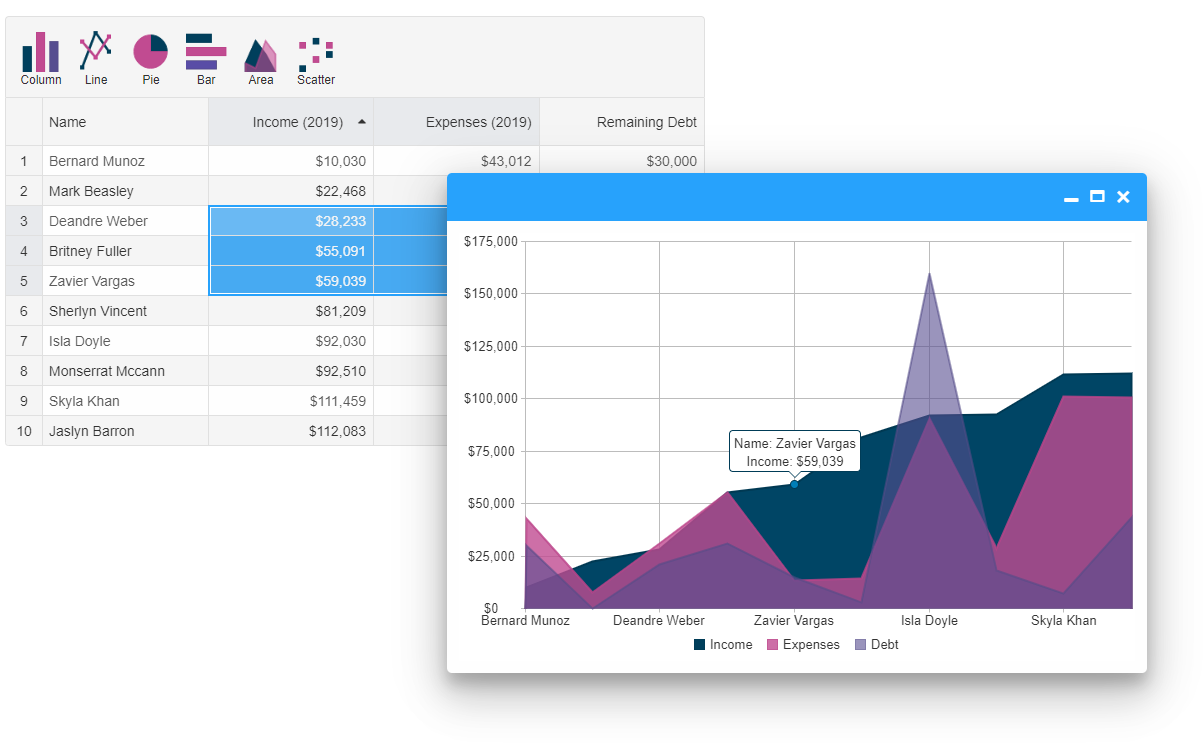
Charts are displayed in our Smart.Window component. You can resize it, maximize it, move it, change its header position, stick it to screen edge, minimize it or just collapse it. Smart.Window is designed to be the most feature-complete Dialog component. It can be either modal or non-modal. Below is displayed a Bar Chart created by selecting multiple rows.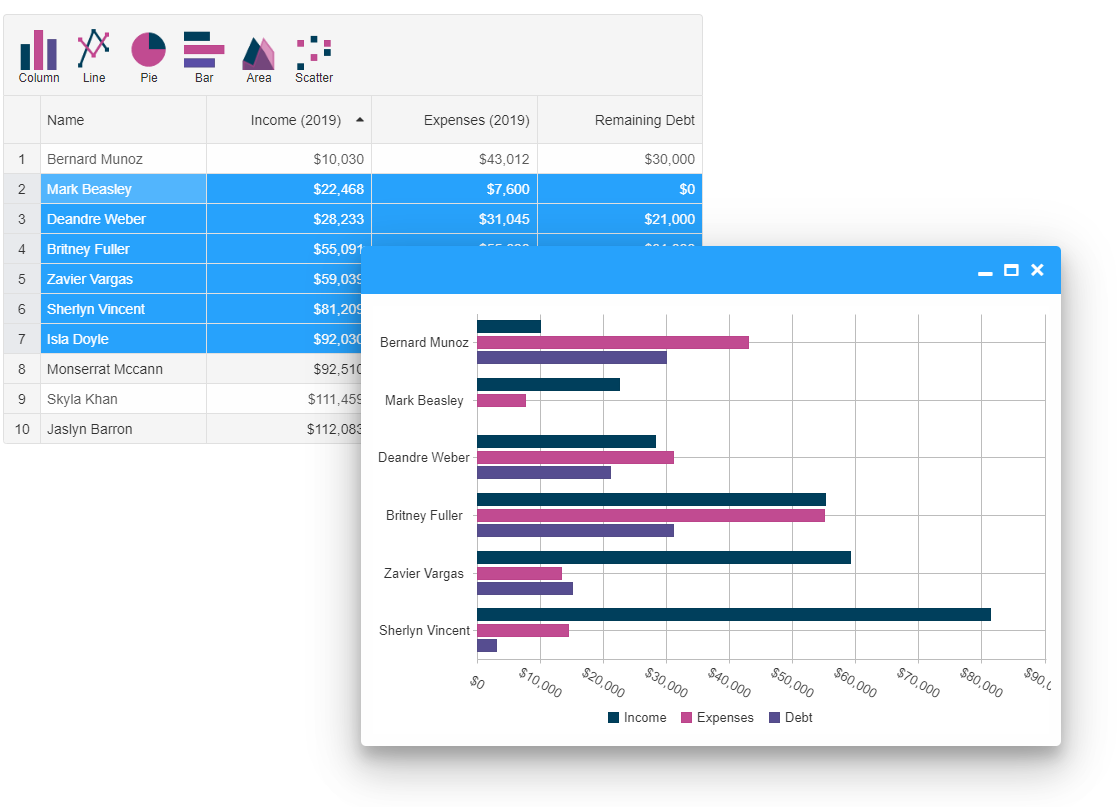
Below is displayed a Pie Chart created by selecting multiple columns. 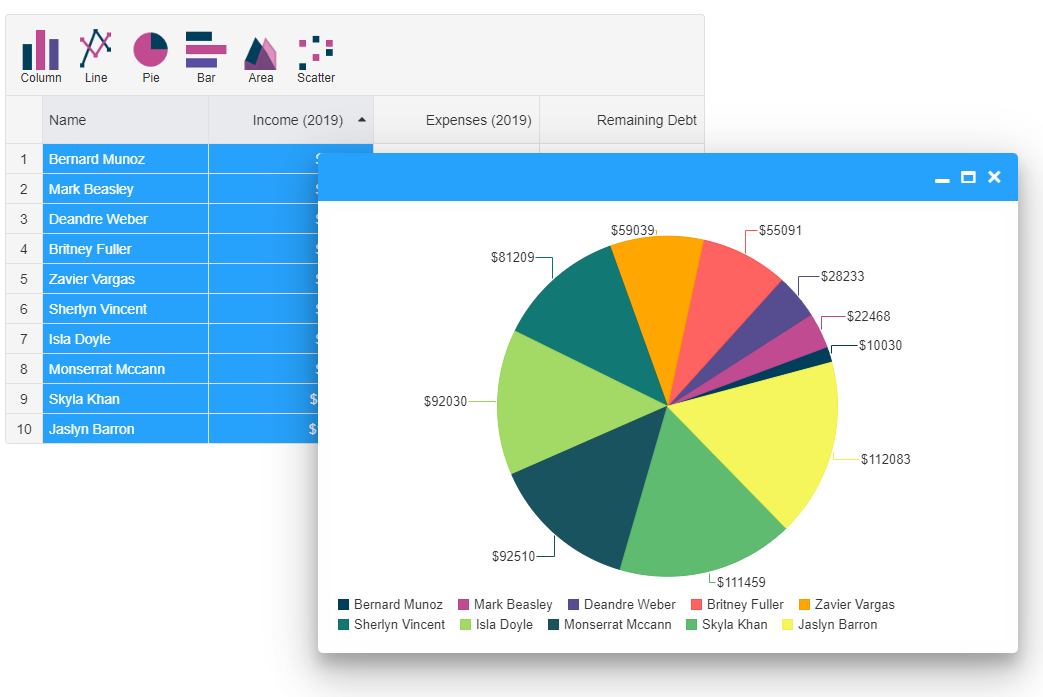
Below is displayed a Column Chart by cells selection. 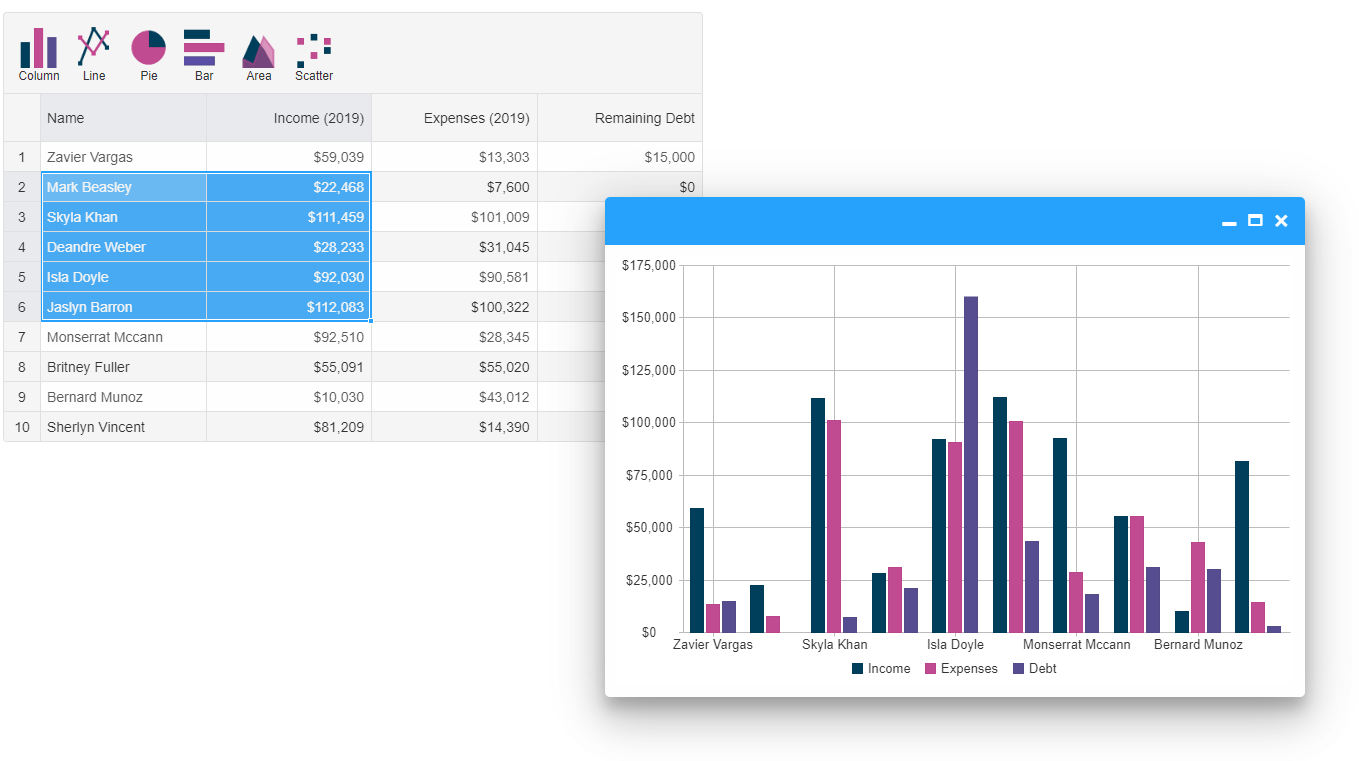
Charts SettingsAs our Charting solution is evolving for the last 10 years, it has quite a lot of settings and Chart types like Financial Charts, Zooming, Spider Charts, etc. You may learn more about our Charting on our demos and documentation pages.
This entry was posted in HTML Elements, Smart Grid, Smart.Chart and tagged charting grid, charting grid data, grid charting, grid charts. Bookmark the permalink.
|
|