Alarm Grid
<smart-alarm-grid>
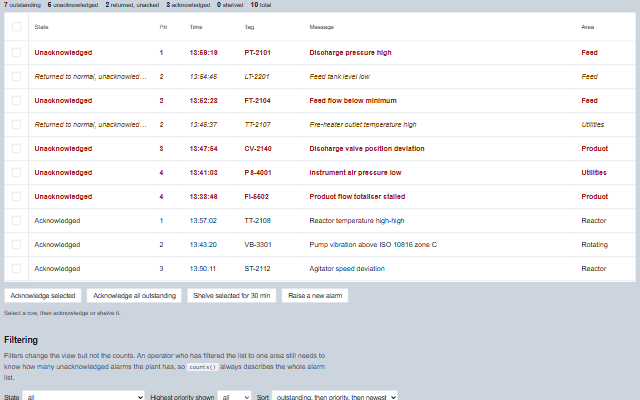
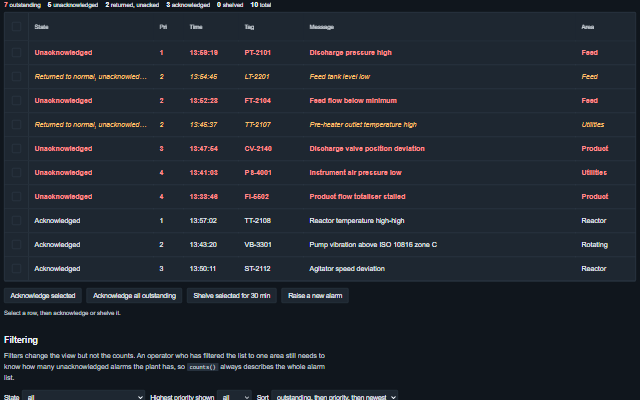
AlarmGrid is an ISA-18.2 alarm summary.
A demo for each of the 54 components and 31 complete operator screens. Every demo page shows the demo with its HTML, JavaScript and CSS, the same demo as an Angular, React and Vue project, and switches between the default theme and the two ISA-101 themes.
Alarms and status Operator screens and process graphics Production floor Recipes, orders and scheduled jobs Maintenance and sites Safety and interlocks Trends and signals Model outputs Instrument readouts and controls Machine state, sequences and sessions Electronic records (21 CFR Part 11) Test and measurement Operator screens
<smart-alarm-grid>
AlarmGrid is an ISA-18.2 alarm summary.
<smart-alarm-banner>
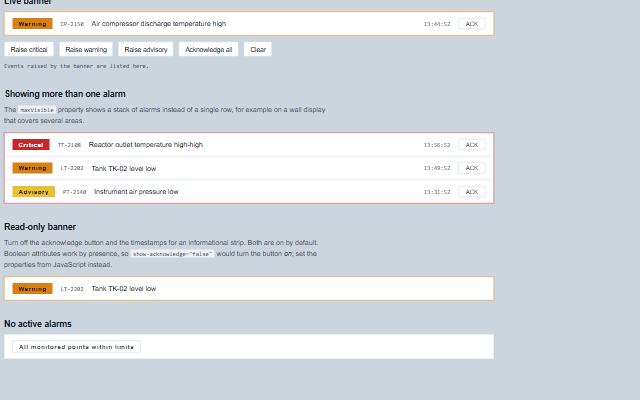
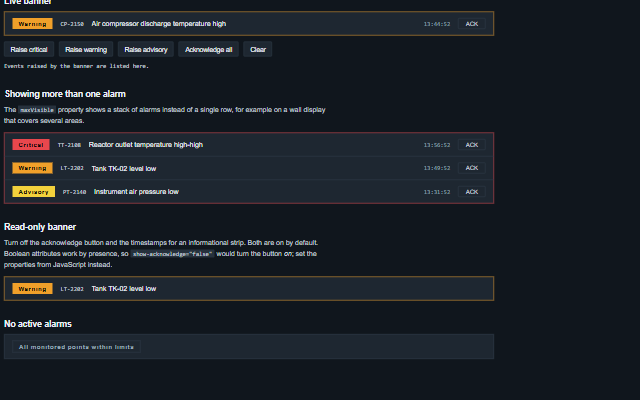
AlarmBanner shows the alarms an operator should deal with next.
<smart-annunciator>
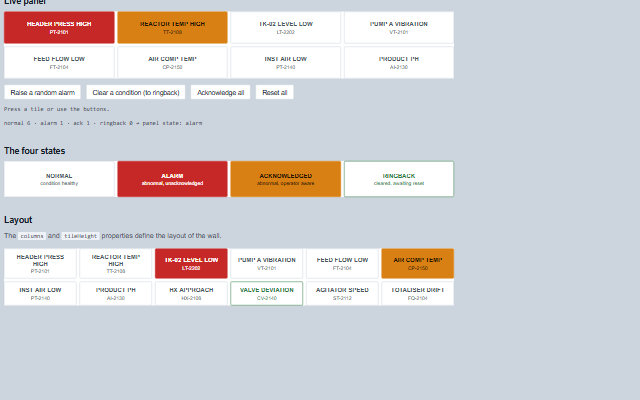
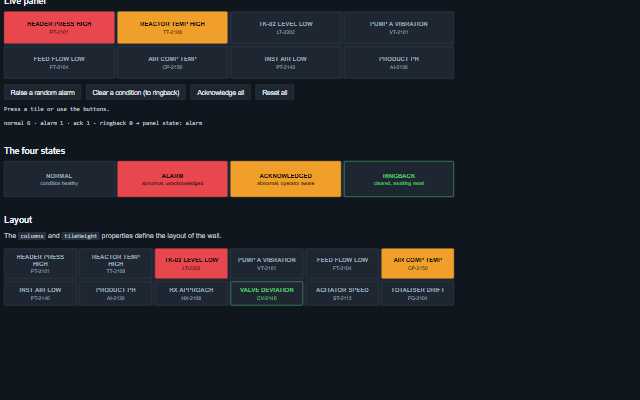
Annunciator displays a wall of tiles, one per monitored condition, following the ISA-18.1 alarm sequence: normal, alarm (unacknowledged, blinking fast), acknowledged (steady) and…
<smart-status-tile>
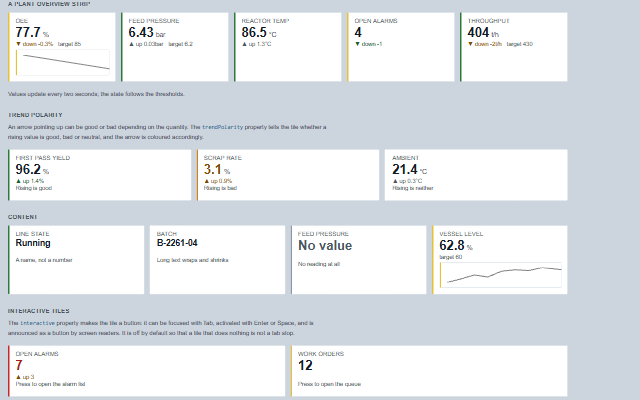
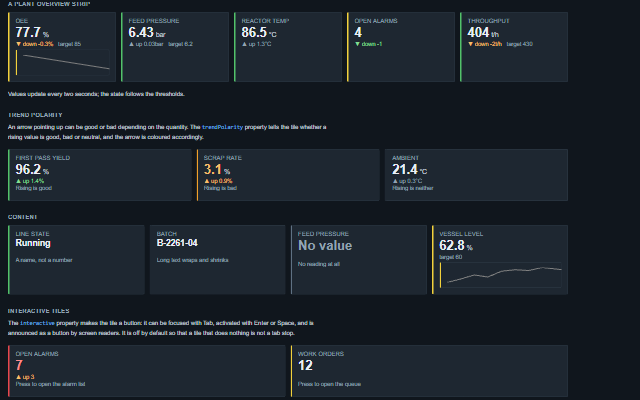
StatusTile displays one process value with its label, unit, state and trend direction, for status walls and plant overview screens.
<smart-multi-state-indicator>
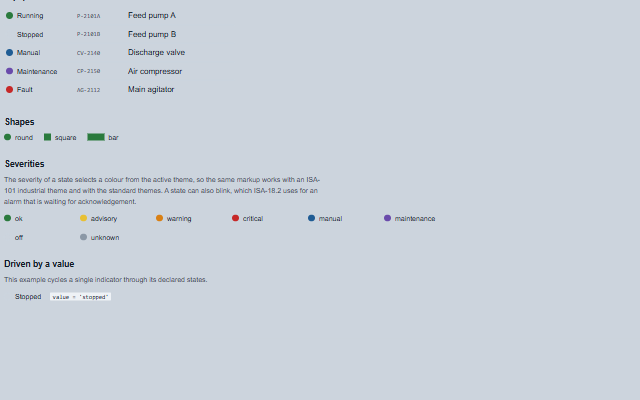
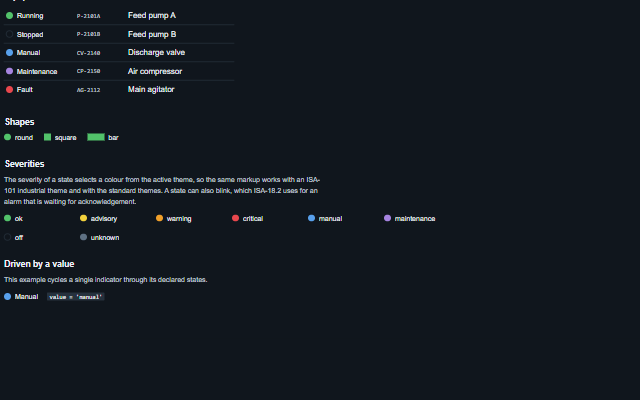
MultiStateIndicator is a read-only lamp that shows one of several named states, such as running, stopped, manual, fault or unknown.
<smart-hmi-shell>
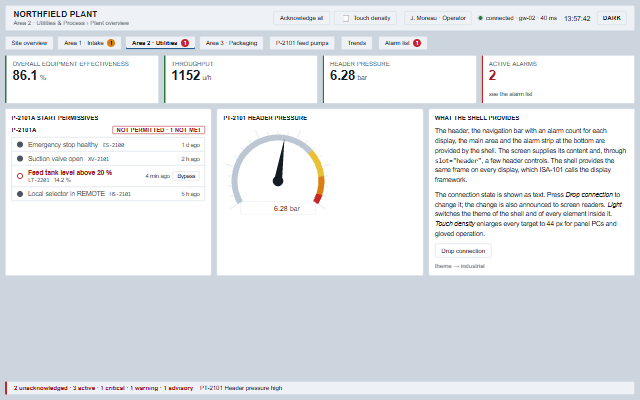
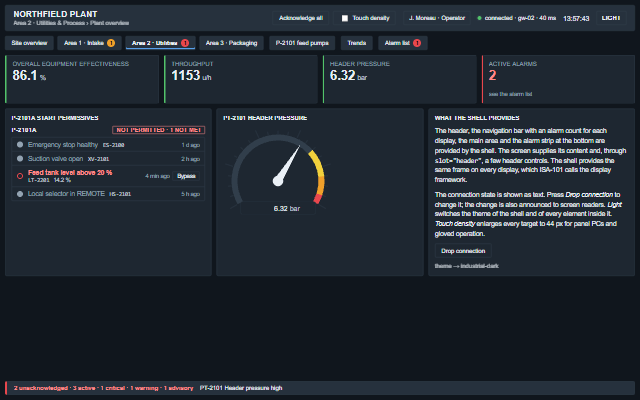
HmiShell is the display frame for operator screens described in ISA-101.
<smart-faceplate>
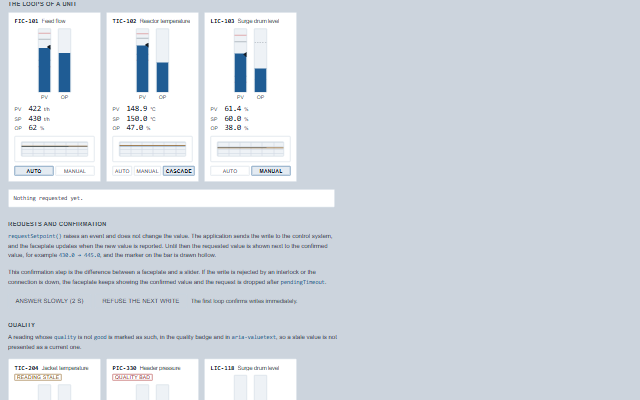
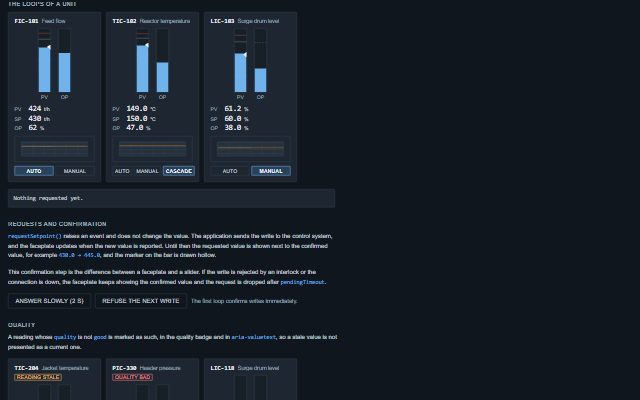
Faceplate is a control loop faceplate that shows the process value, the setpoint and the controller output of a loop together with its mode.
<smart-device-control>
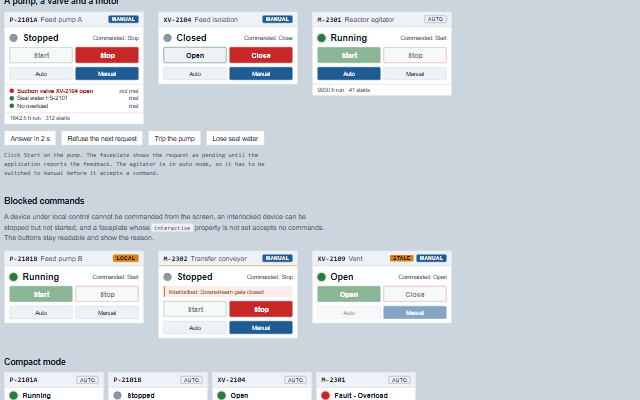
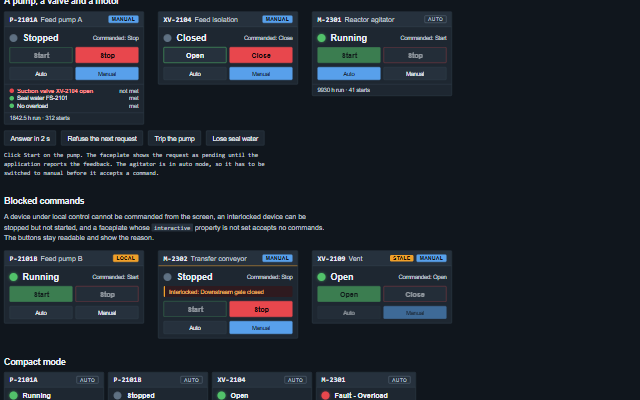
DeviceControl is a faceplate for a discrete device such as a motor, a pump or an on/off valve.
<smart-mimic>
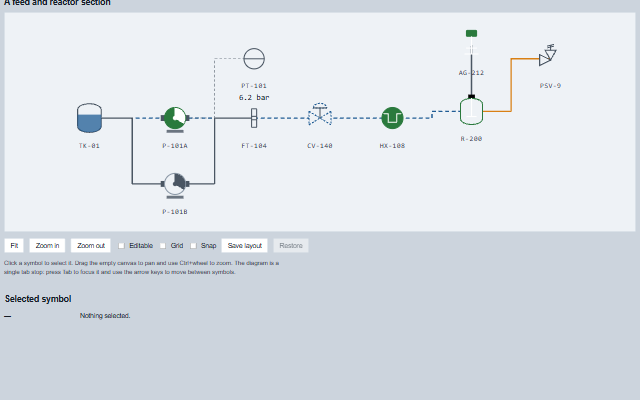
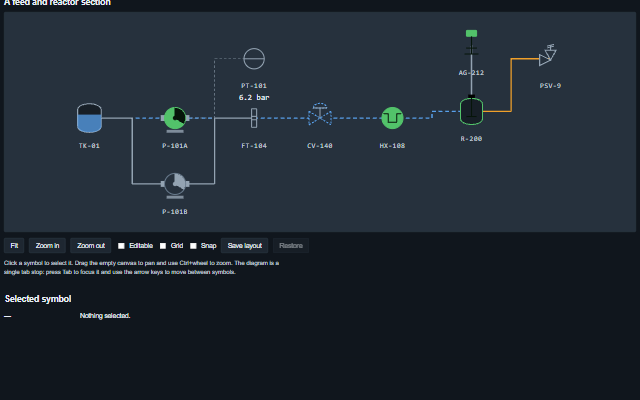
Mimic is a process diagram canvas.
<smart-mimic-symbol>
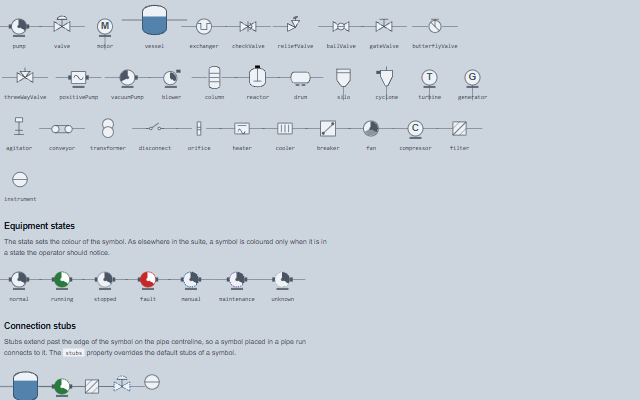
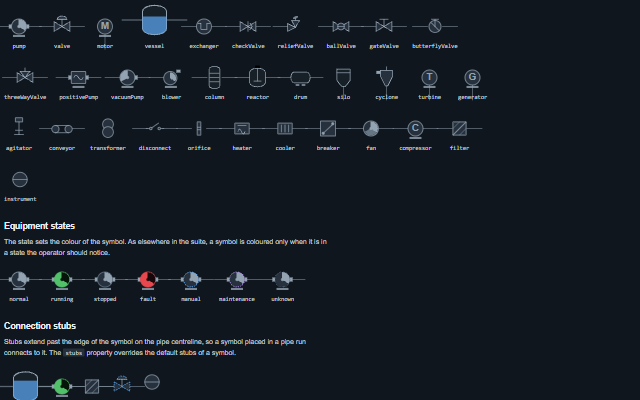
MimicSymbol displays one piece of equipment on a process diagram, such as a pump, a valve, a tank or a motor, with its tag, state and reading.
<smart-pipe>
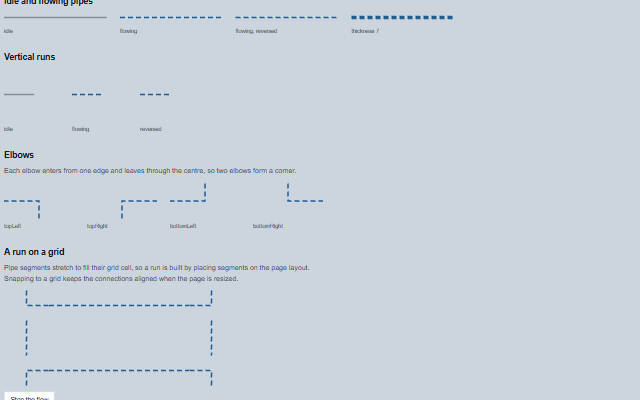
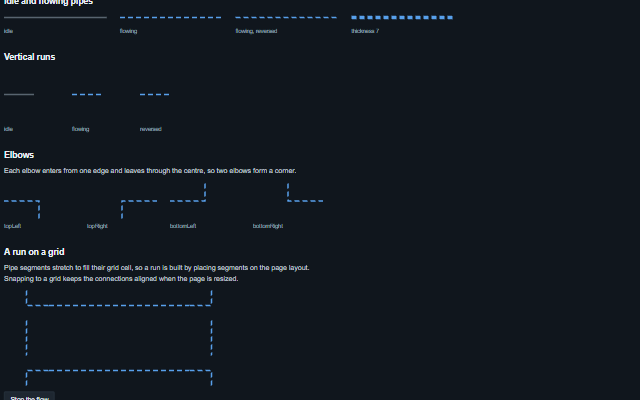
Pipe displays a section of process line on a mimic diagram.
<smart-stack-light>
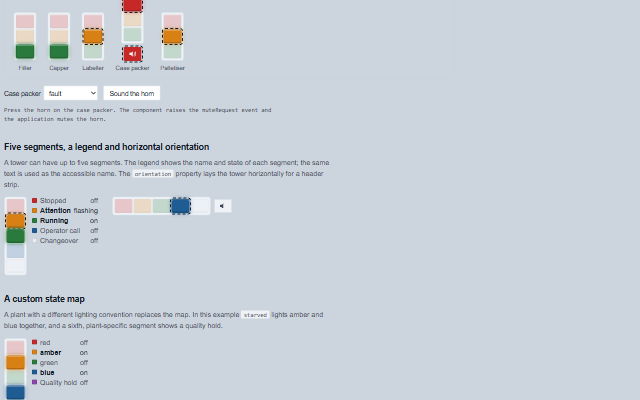
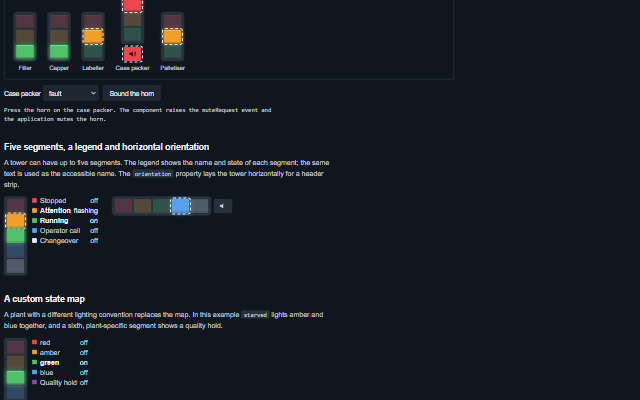
StackLight displays the tower light of a machine as a column of coloured segments that can be off, on, flashing or flashing fast, with an optional horn.
<smart-state-timeline>
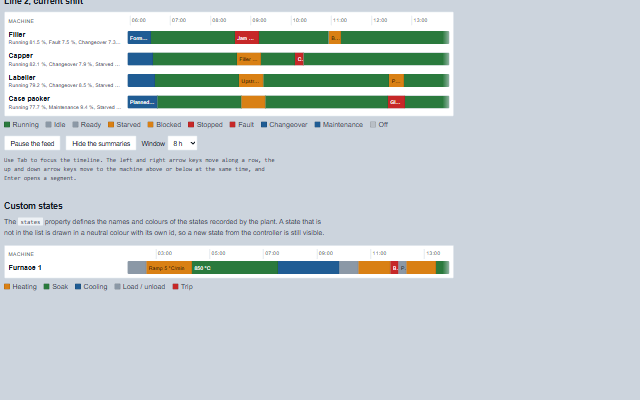
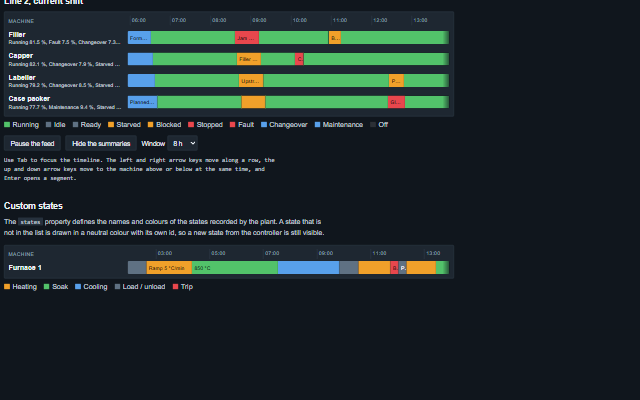
StateTimeline displays the state history of one or more machines as coloured segments on a time axis, one row per machine.
<smart-downtime-log>
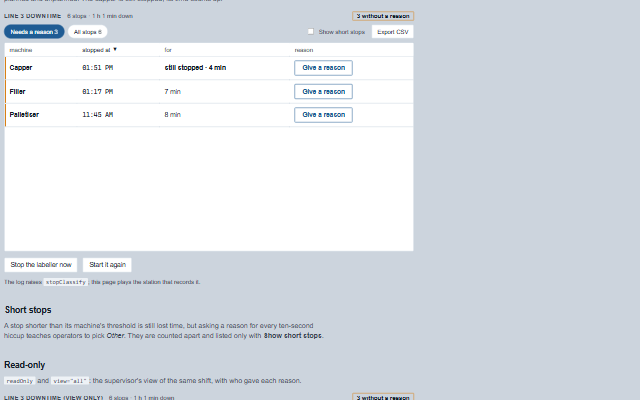
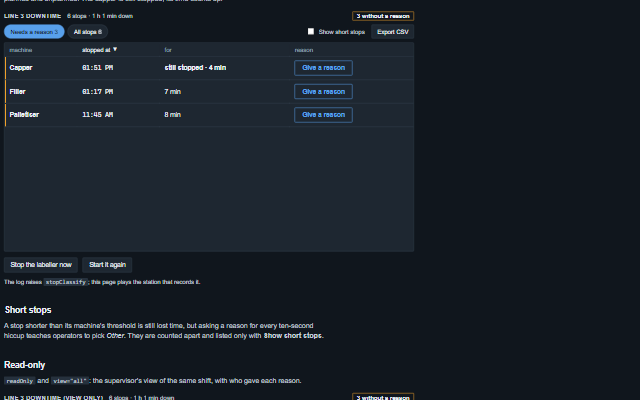
DowntimeLog lists every stop of a line and asks the person who was there why it stopped.
<smart-shift-log>
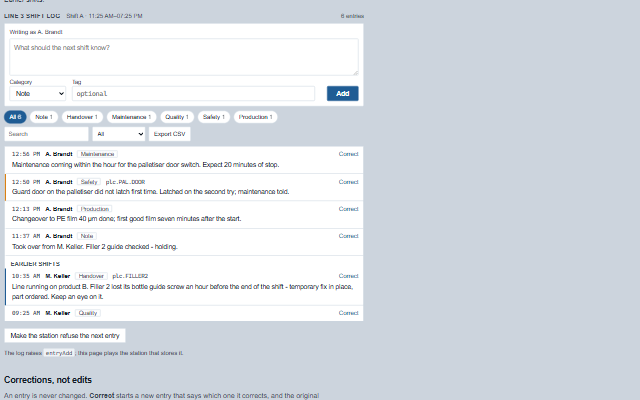
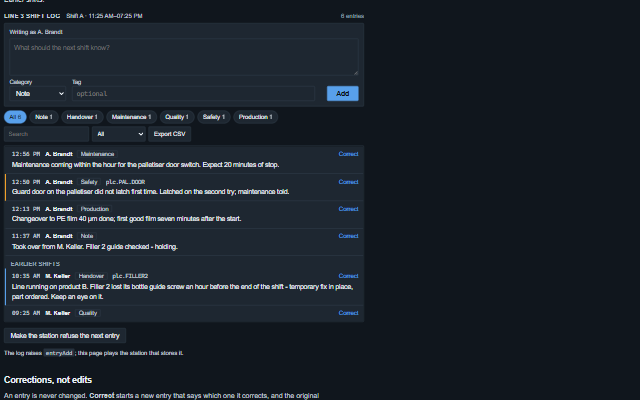
ShiftLog is the book on the control-room desk, kept where the screens are: what one shift needs the next to know that no tag says - that a filler jammed twice and was cleared by hand,…
<smart-recipe-panel>
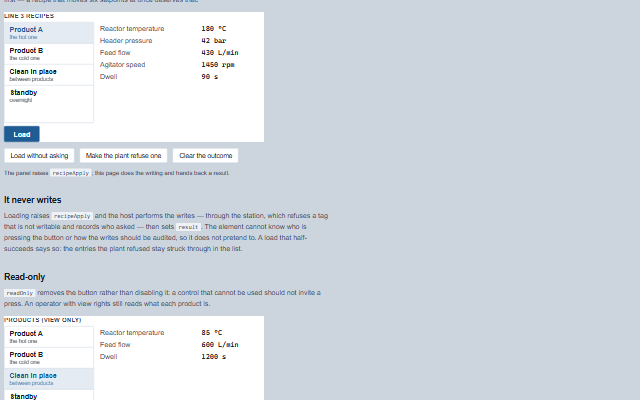
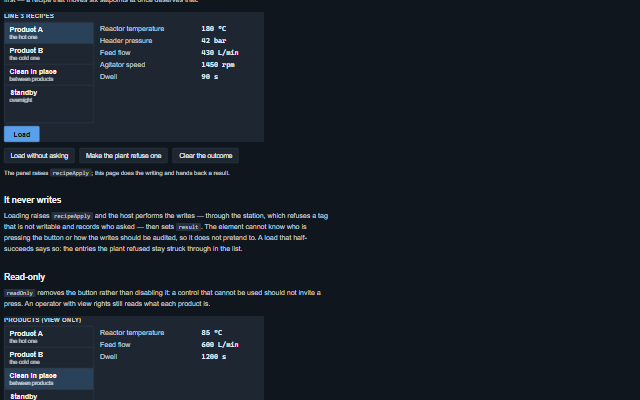
RecipePanel lists the recipes a line can be set to and loads one into the plant in a single action.
<smart-order-queue>
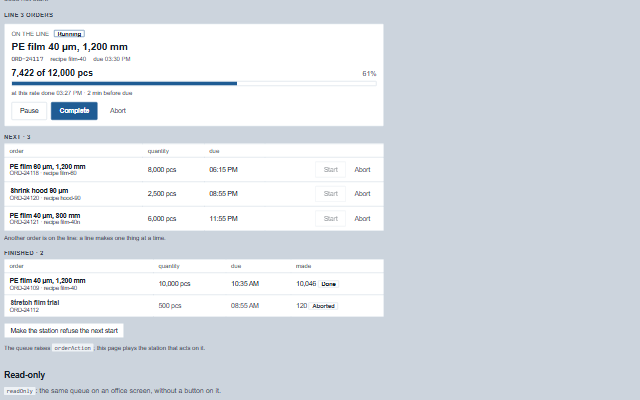
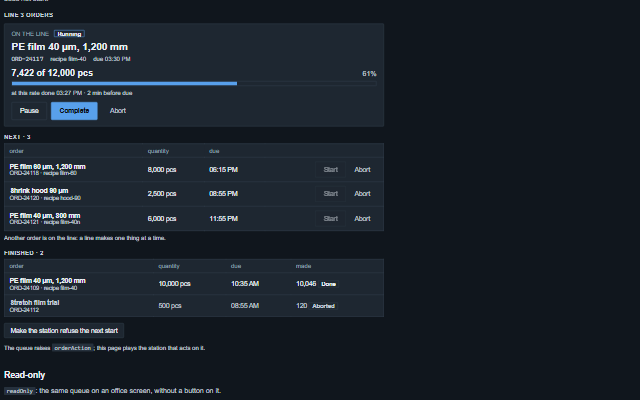
OrderQueue shows what a line is making, how far along it is, and what comes next.
<smart-job-panel>
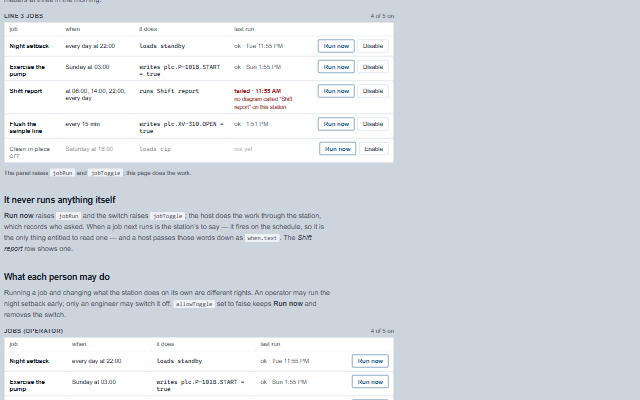
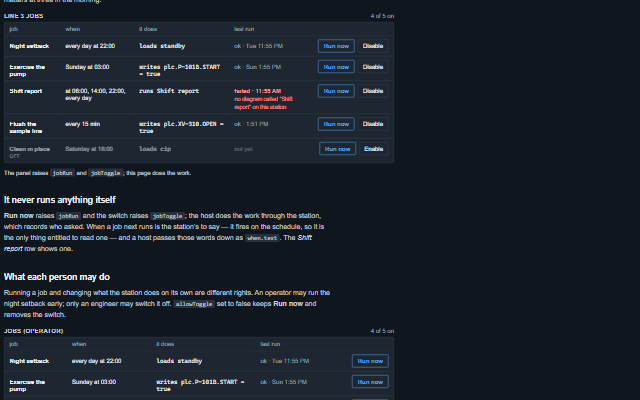
JobPanel shows what a station does on its own - the jobs it runs because of the clock rather than because of a person - with what each does, when it runs and how it went last time.
<smart-asset-card>
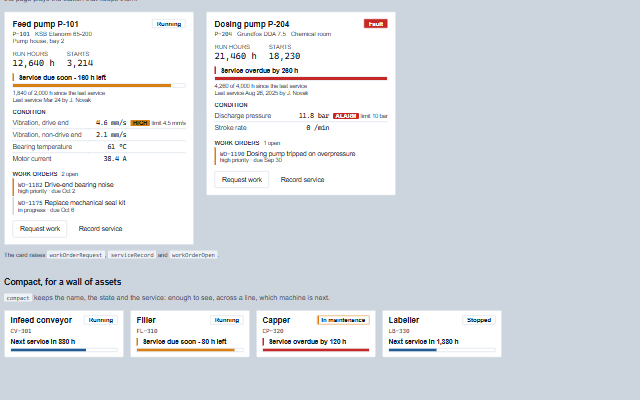
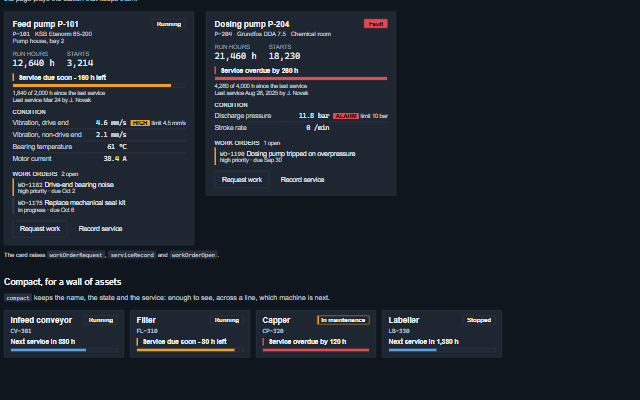
AssetCard is one machine as maintenance sees it: how long it has run, when it is next due for service, how it is doing and what is open against it.
<smart-site-map>
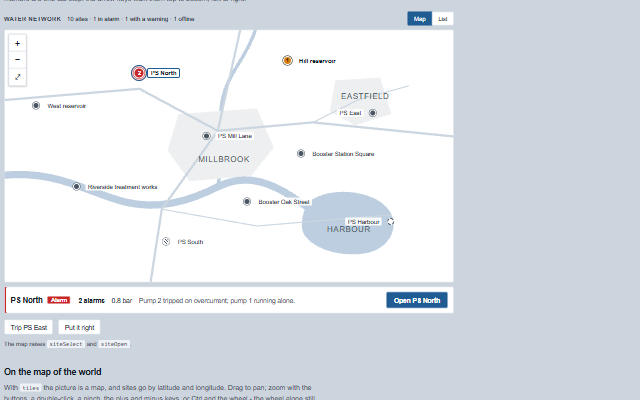
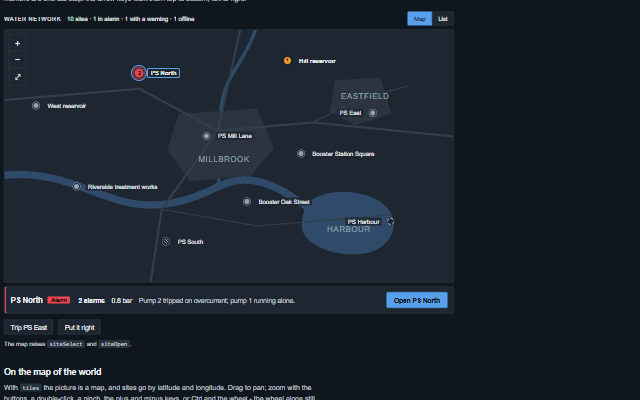
SiteMap puts many sites on one picture - the pump stations of a water network, the turbines of a wind farm, the substations of a grid - so that "where is something wrong" is answered…
<smart-cause-effect-matrix>
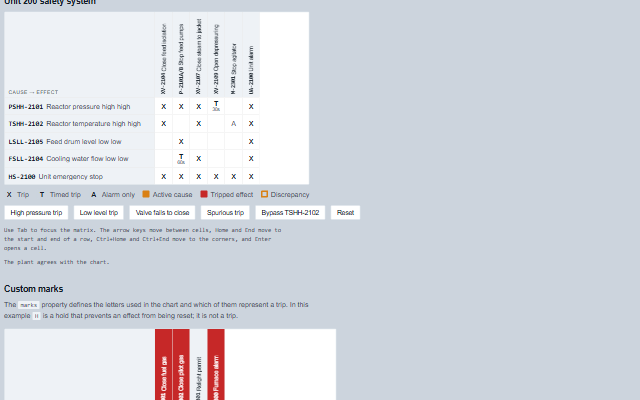
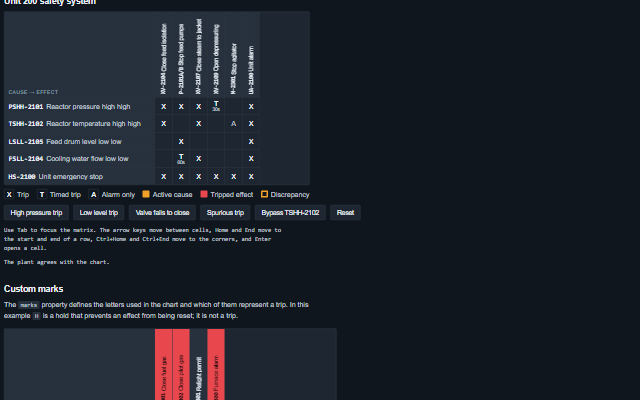
CauseEffectMatrix displays the cause and effect chart of a safety instrumented system as a live matrix.
<smart-permissive>
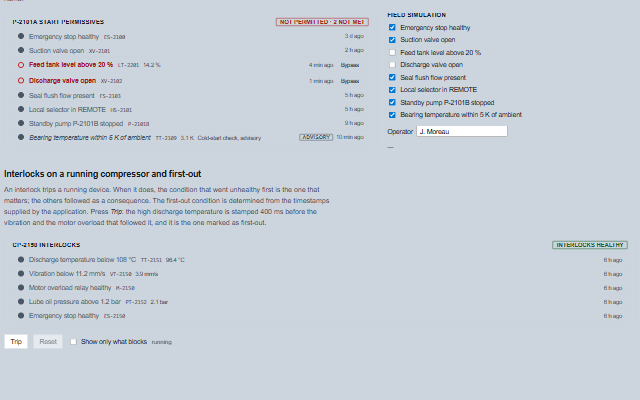
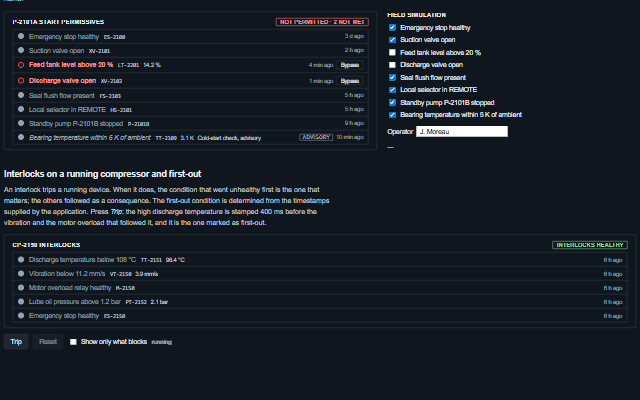
Permissive displays a list of conditions that a start requires or that a running device depends on, with whether each condition is met.
<smart-trend>
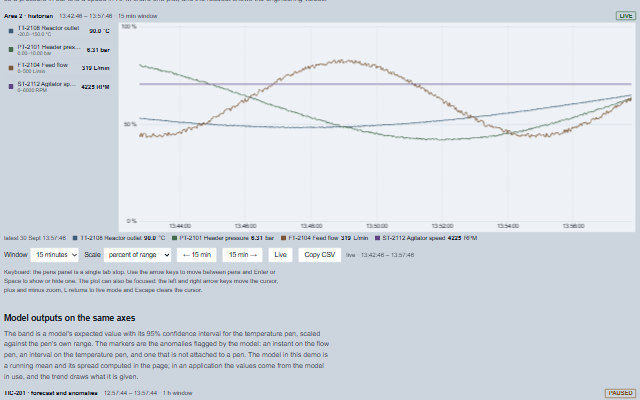
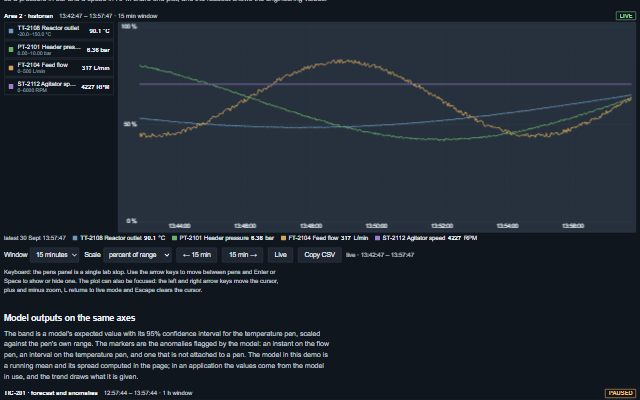
Trend is a historian trend chart for process data.
<smart-strip-chart>
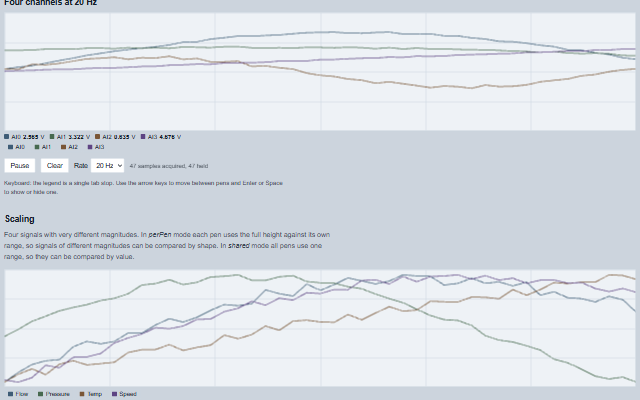
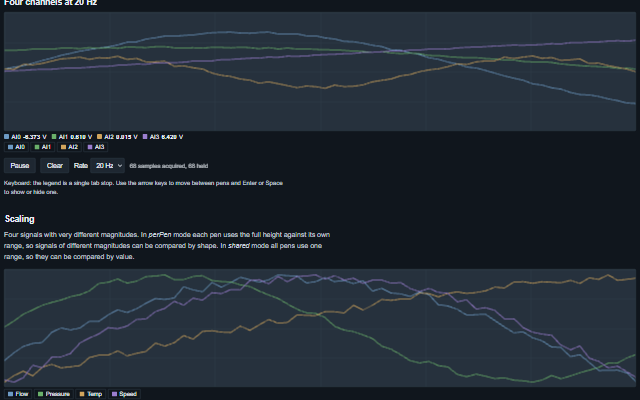
StripChart is a real-time chart for continuously acquired samples: the newest sample is drawn at the right and the oldest leaves at the left.
<smart-scope>
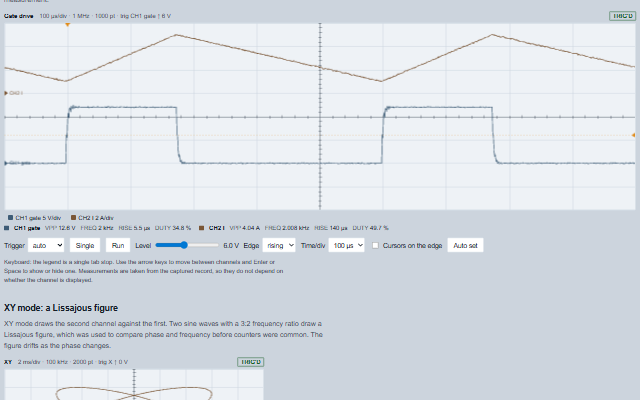
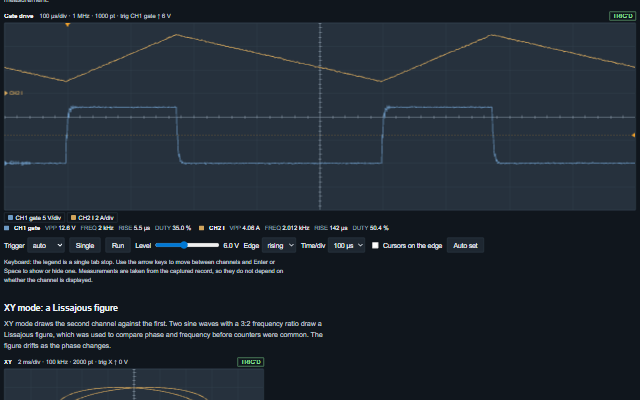
Scope is an oscilloscope display for time-domain signals.
<smart-spectrum>
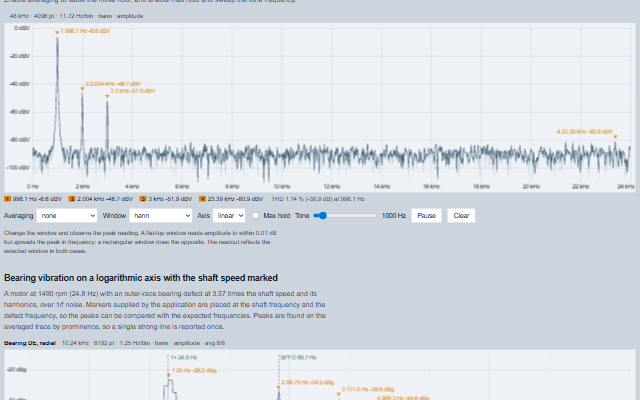
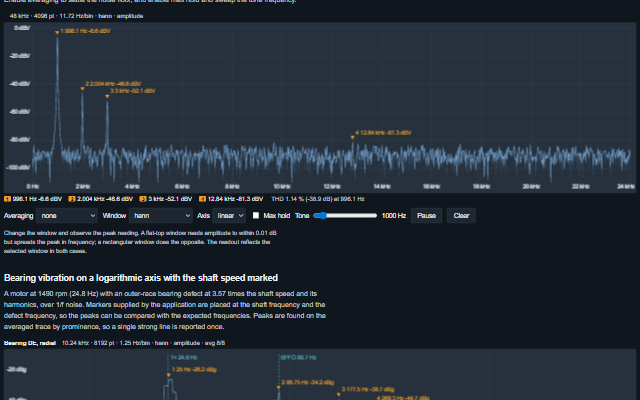
Spectrum is a spectrum analyzer display.
<smart-control-chart>
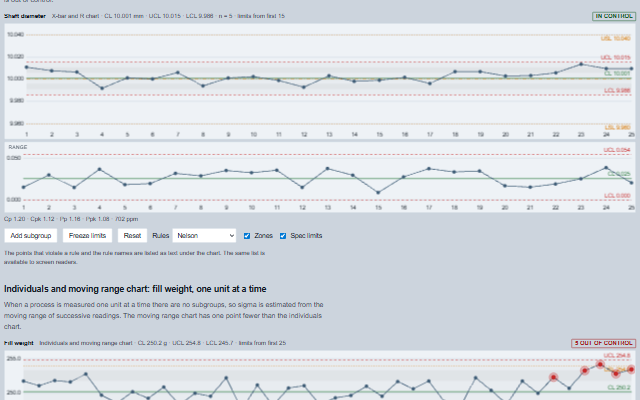
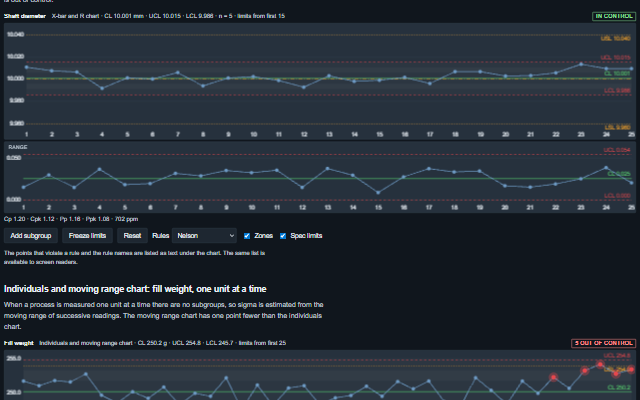
ControlChart is a Shewhart control chart for statistical process control.
<smart-comparison-chart>
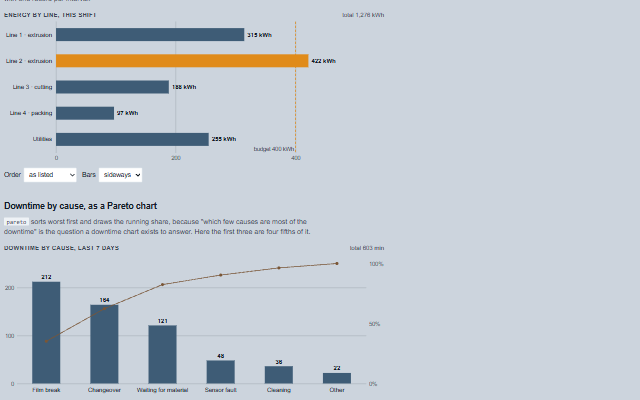
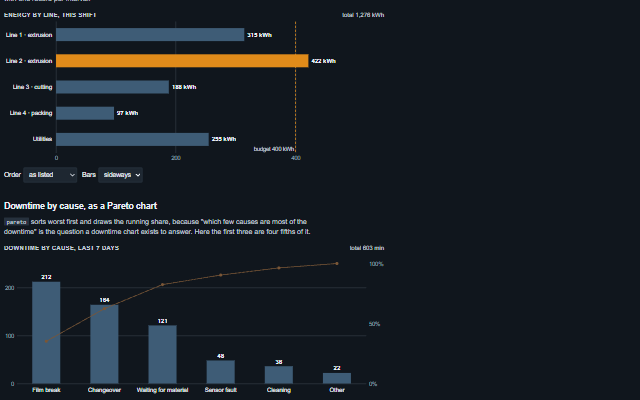
ComparisonChart puts like values side by side - energy per line, output per shift, downtime per cause, the share of each product in a day - and answers which is the biggest, and by how much.
<smart-anomaly-heatmap>
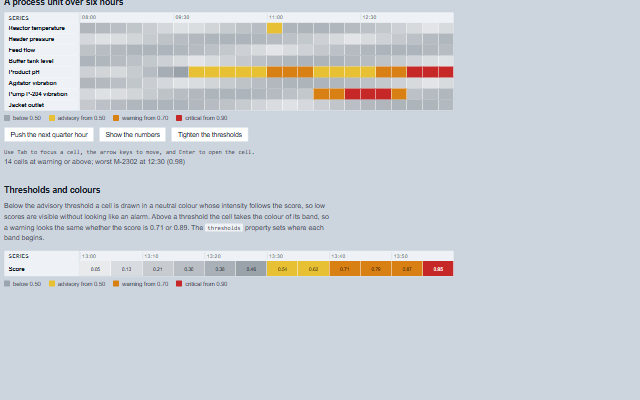
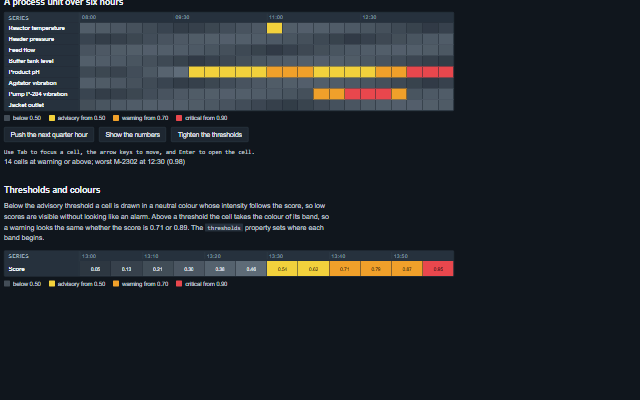
AnomalyHeatmap displays anomaly scores as a heatmap with one row per tag or asset and one column per time interval.
<smart-root-cause-tree>
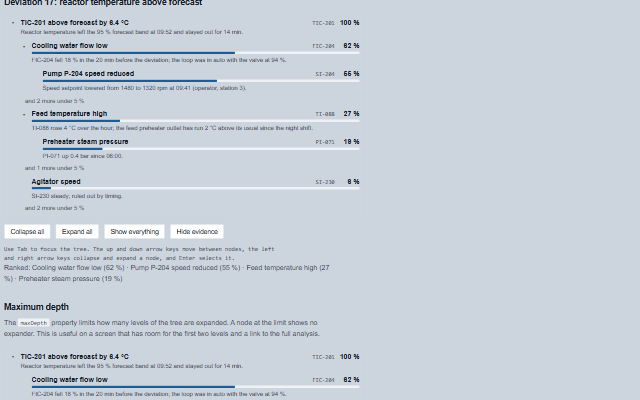
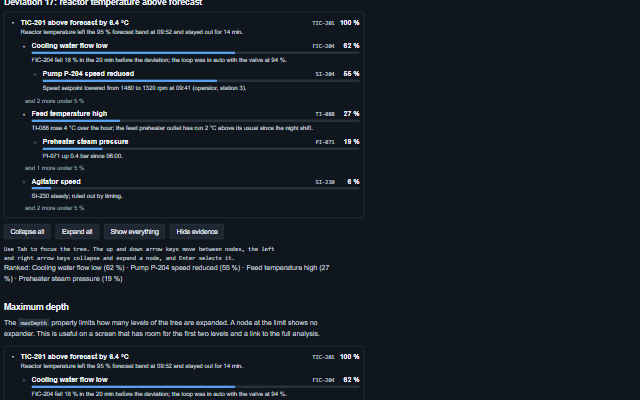
RootCauseTree displays the ranked, nested explanation produced by a root-cause analysis model: the deviation at the root, the contributing conditions below it and their share of the…
<smart-seven-segment>
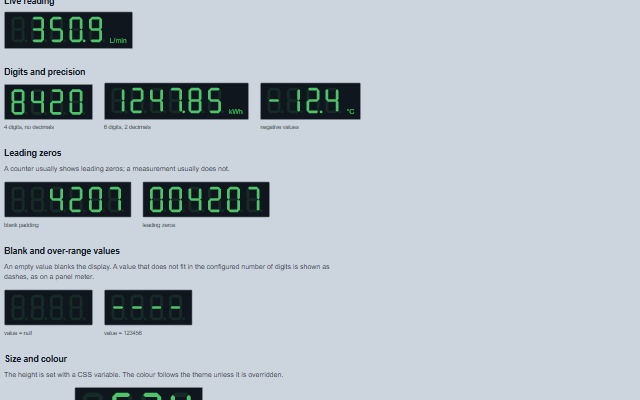
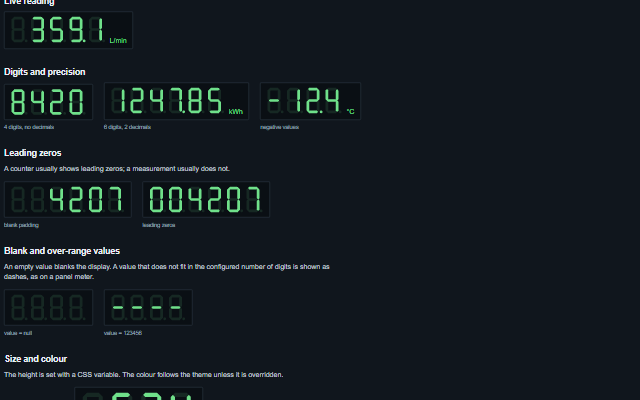
SevenSegment is a numeric display in the style of a seven-segment LED readout, for panel meters, totalizers and counters.
<smart-bar-graph>
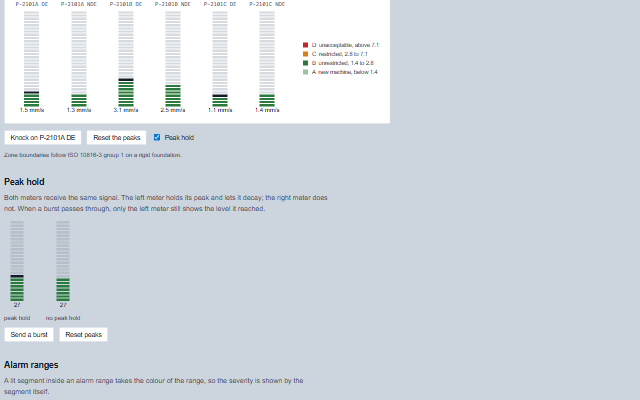
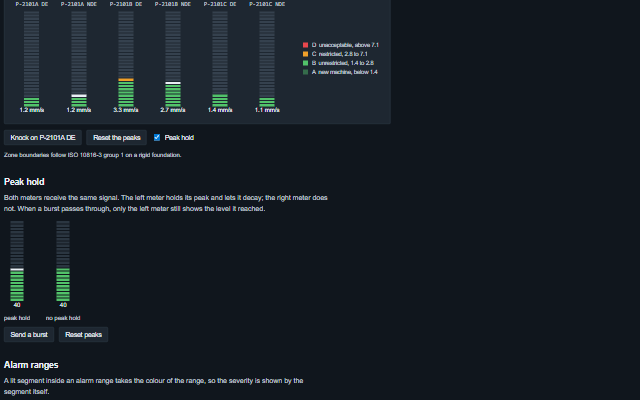
BarGraph is a segmented level meter, such as the column of lit blocks on an audio console or a vibration monitor.
<smart-thermometer>
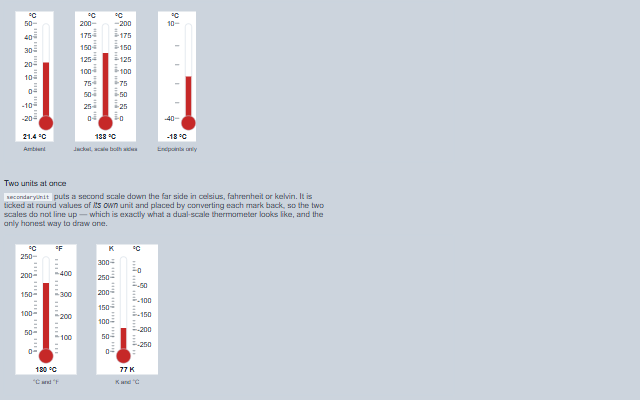
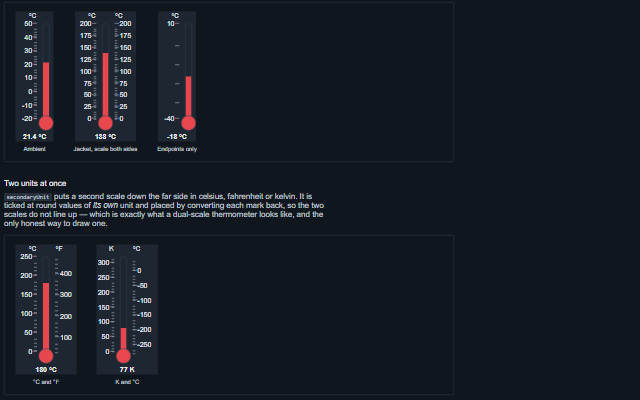
Thermometer shows a temperature as the instrument that measures it: a bulb that always holds the liquid, a capillary stem above it and a column standing at the reading.
<smart-panel-meter>
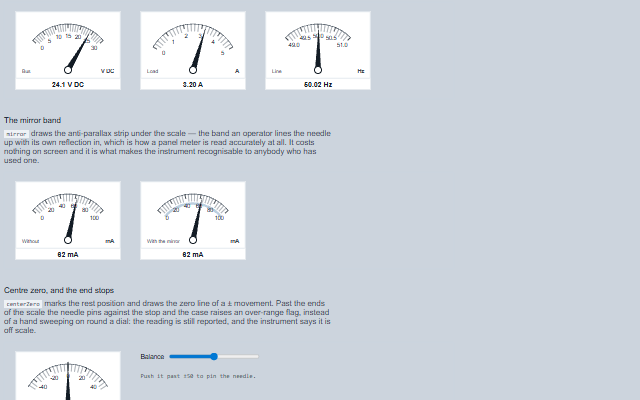
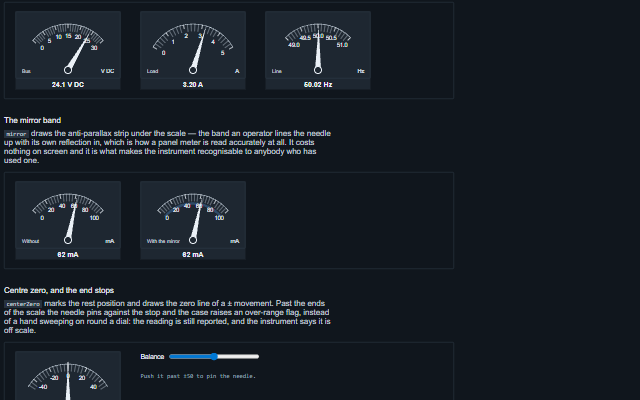
PanelMeter draws the moving-coil instrument screwed into the front of a rack: a rectangular case, a shallow arc of scale across the top of it and a long needle swinging from a pivot near…
<smart-knob>
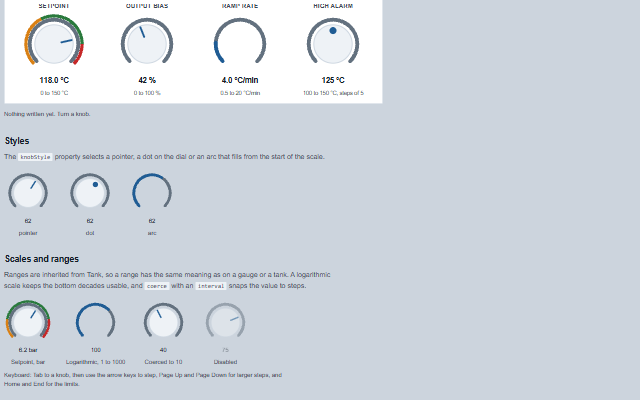
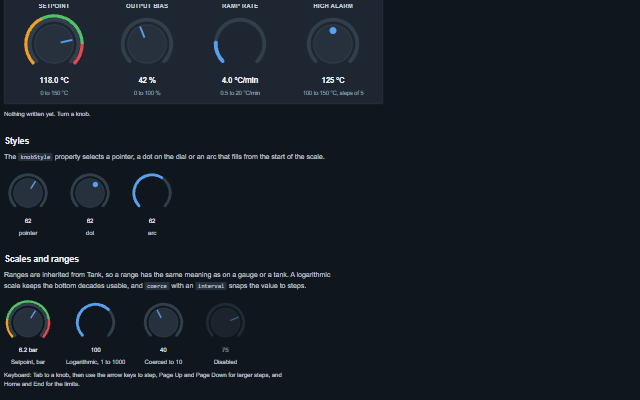
Knob is a rotary control for setting a value.
<smart-bit-field>
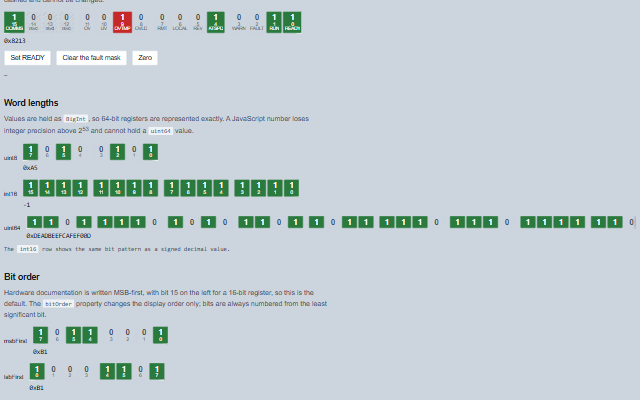
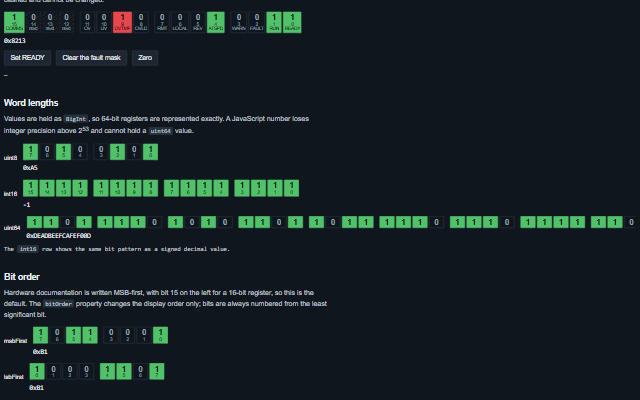
BitField displays a fixed-width register as individual bits with names, keeping the word value and the bits in sync.
<smart-numeric-keypad>
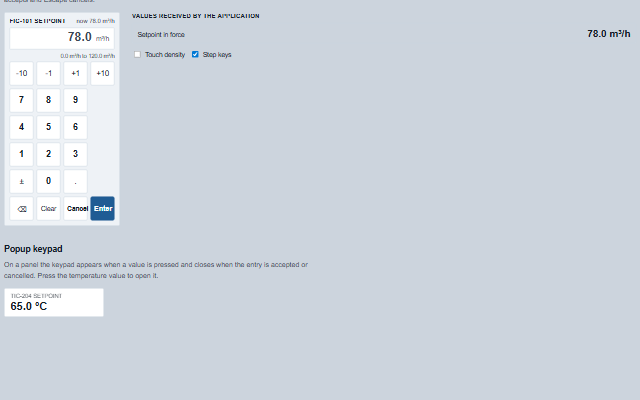
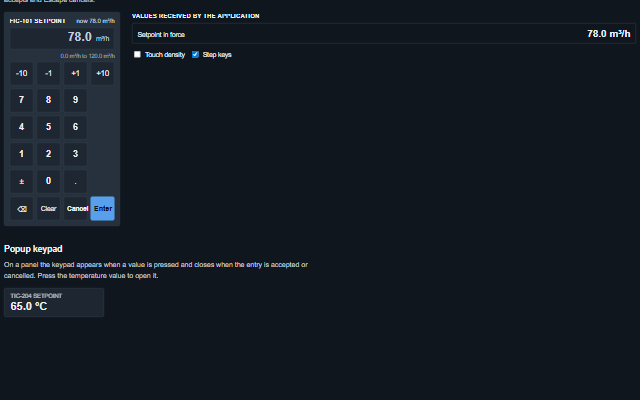
NumericKeypad is an on-screen keypad for entering a numeric value such as a setpoint on a touch panel.
<smart-touch-keyboard>
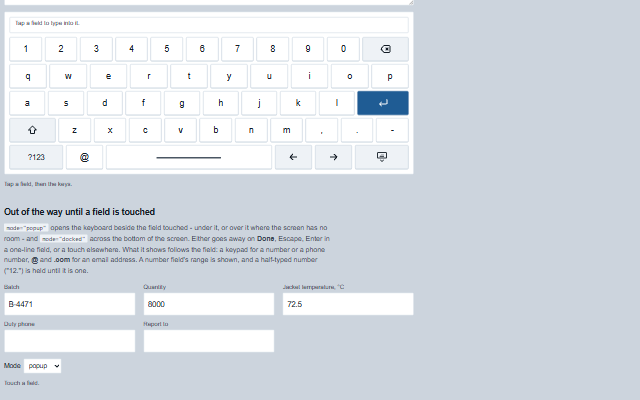
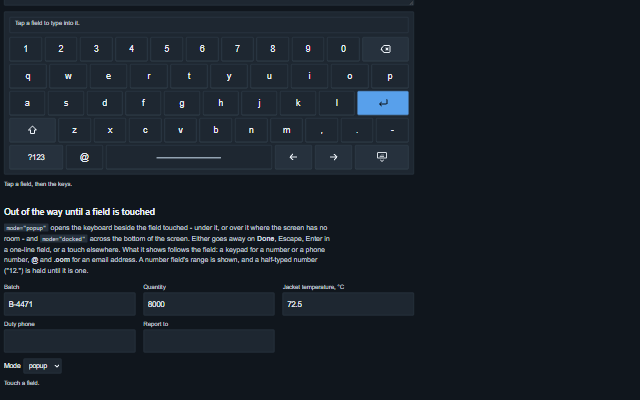
TouchKeyboard is the on-screen keyboard for a panel PC that has none, or a kiosk browser whose system keyboard covers the field it types into.
<smart-momentary-button>
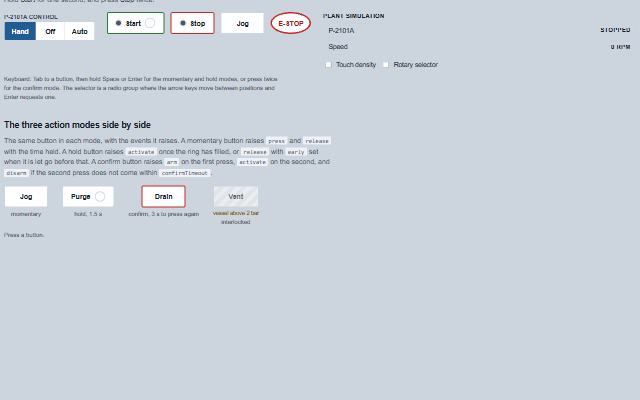
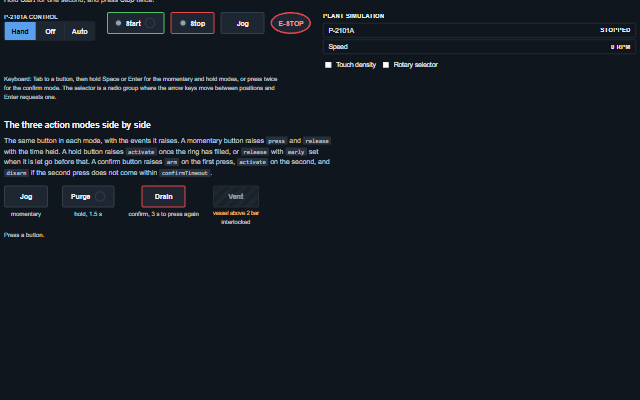
MomentaryButton is an operator button with three action modes.
<smart-selector-switch>
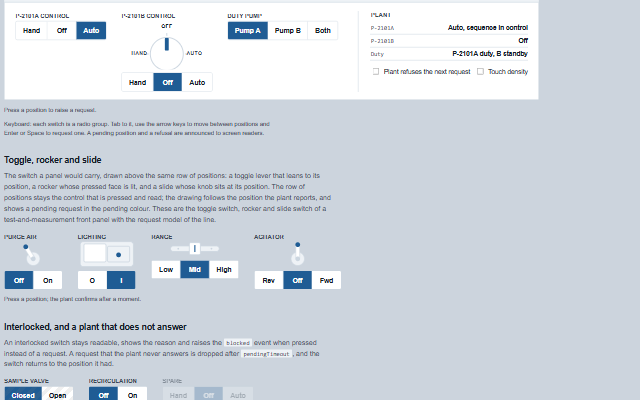
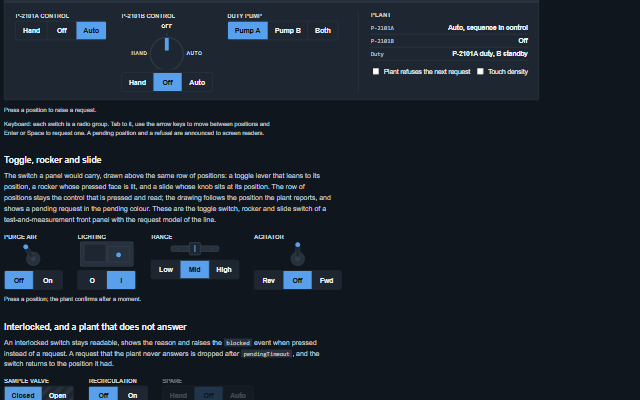
SelectorSwitch is a switch with a set of named positions, such as a Hand-Off-Auto selector, a duty/standby selector or a local/remote switch.
<smart-jog-panel>
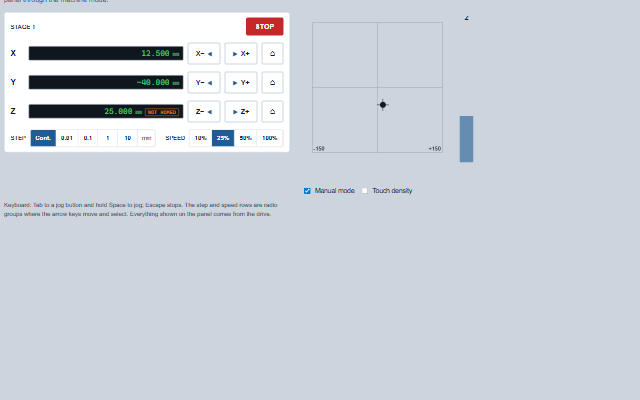
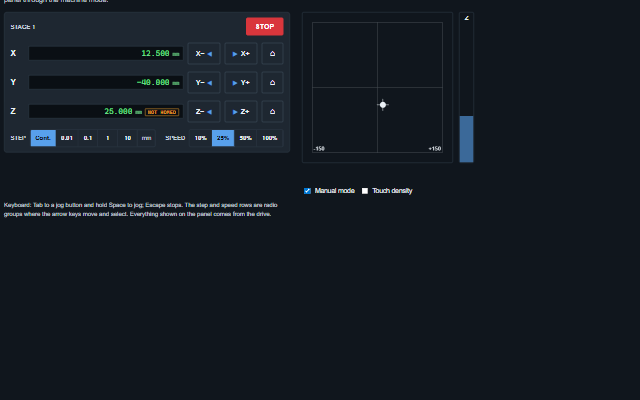
JogPanel is the manual motion panel of a machine pendant.
<smart-state-machine>
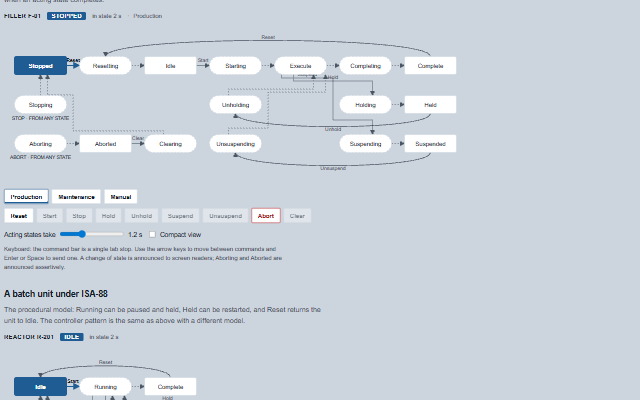
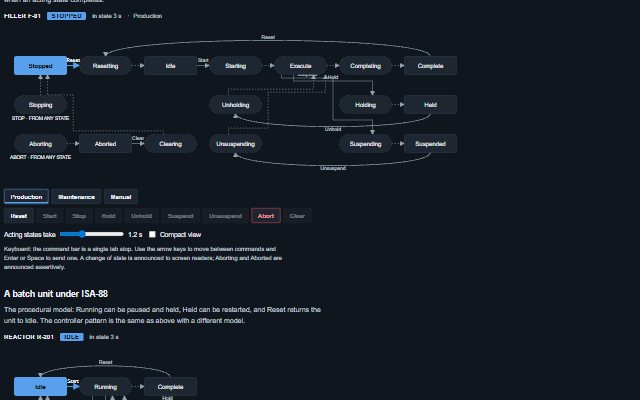
StateMachine displays the state model of a machine as a diagram with the current state highlighted, the time in the state, the unit mode and the commands that are available from the…
<smart-sequence-editor>
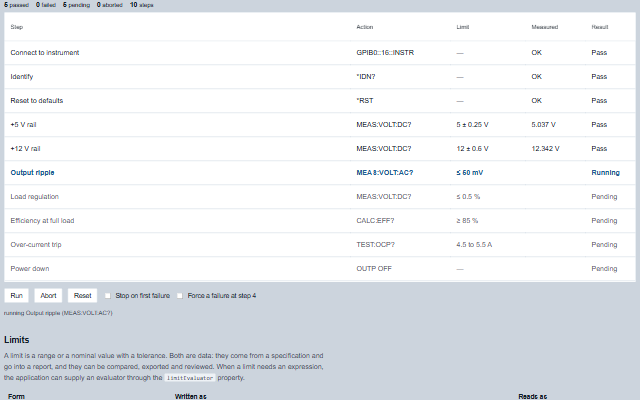
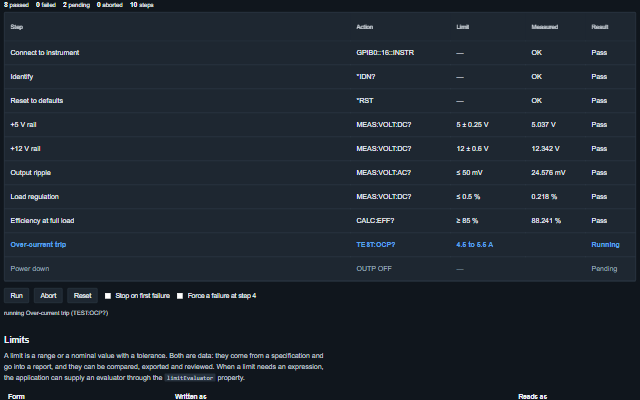
SequenceEditor is a step sequence editor and runner for test sequences, batch procedures and recipes.
<smart-terminal>
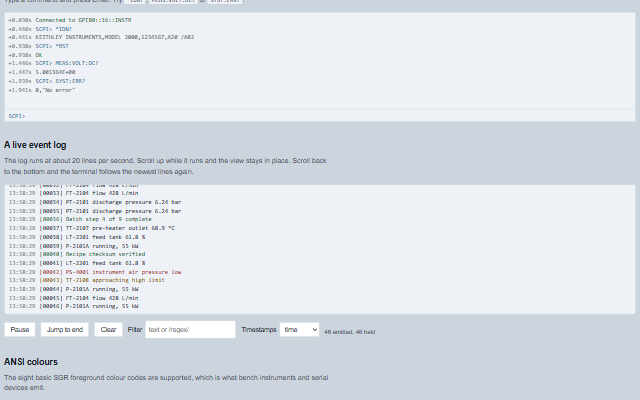
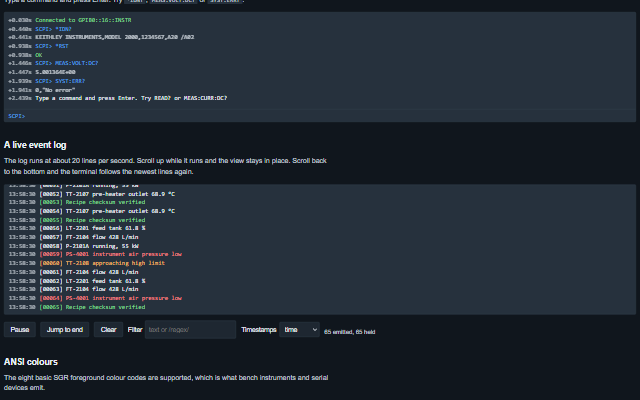
Terminal displays a stream of lines, such as an instrument session or an event log, at a high rate.
<smart-esignature>
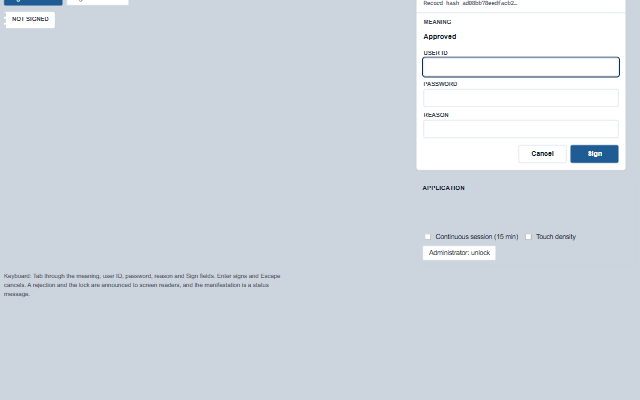
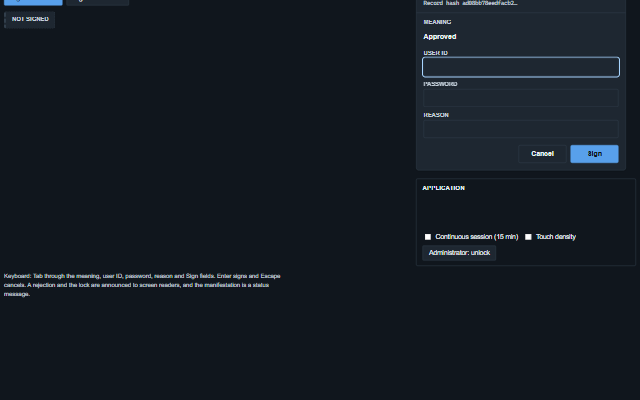
ESignature provides the electronic signature dialog described in 21 CFR Part 11.
<smart-signature-block>
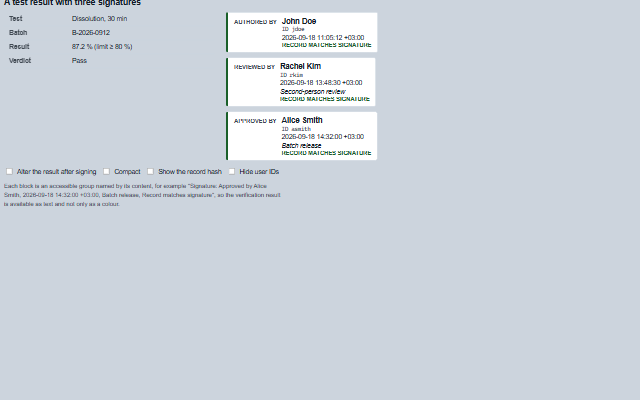
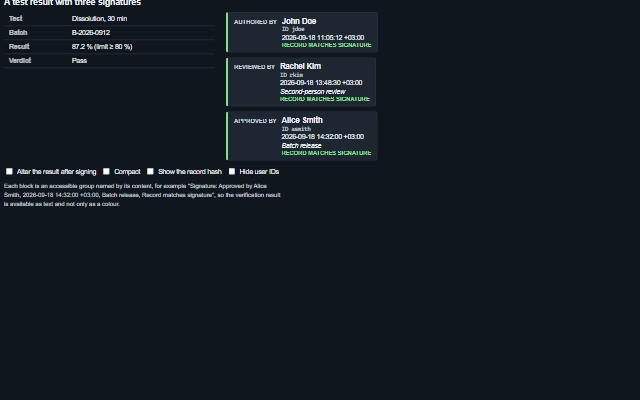
SignatureBlock displays the signature manifestation required by 21 CFR Part 11 §11.50: the meaning of the signature, the printed name of the signer, the date and time of signing with the…
<smart-audit-trail>
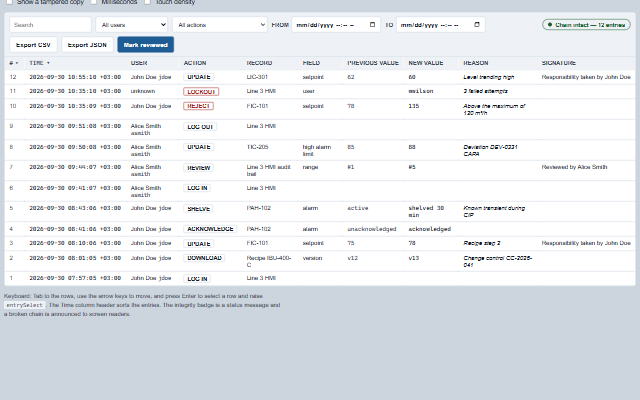
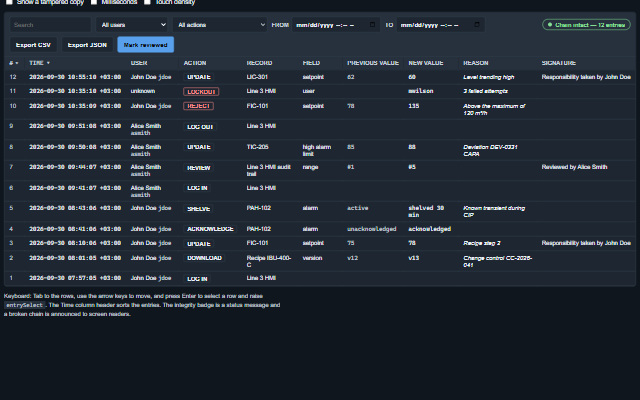
AuditTrail displays audit trail entries for review, as required by 21 CFR Part 11 §11.10(e).
<smart-waveform-graph>
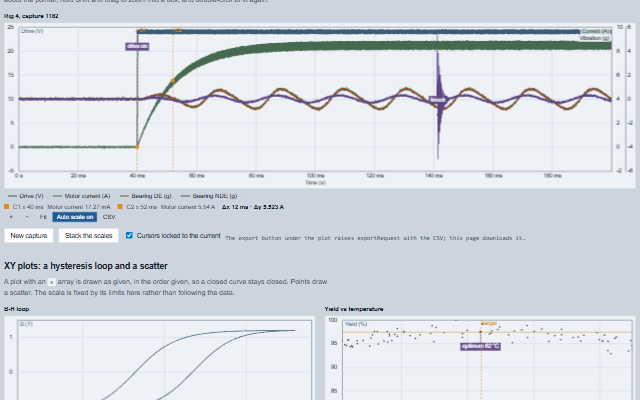
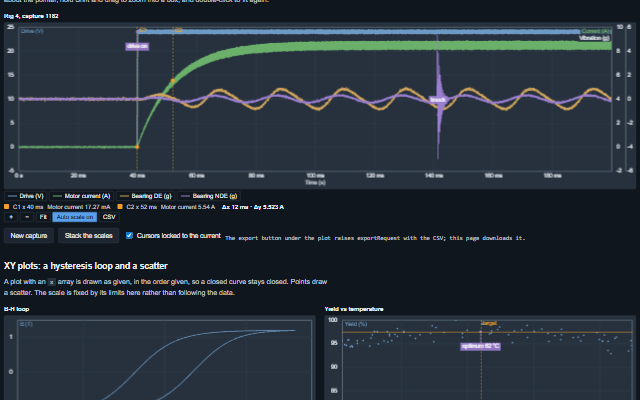
WaveformGraph displays complete records against engineering axes: waveforms with a start time and a sample interval, or XY pairs.
<smart-intensity-graph>
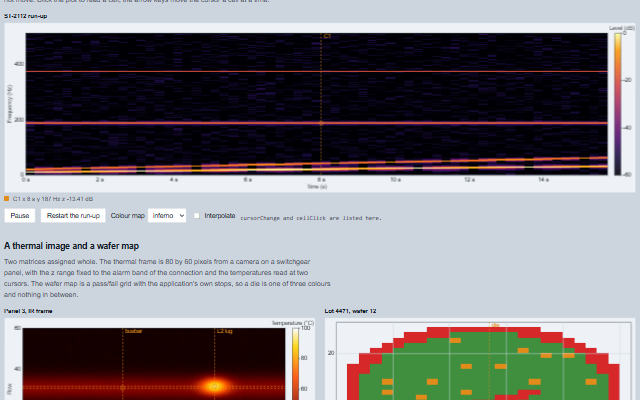
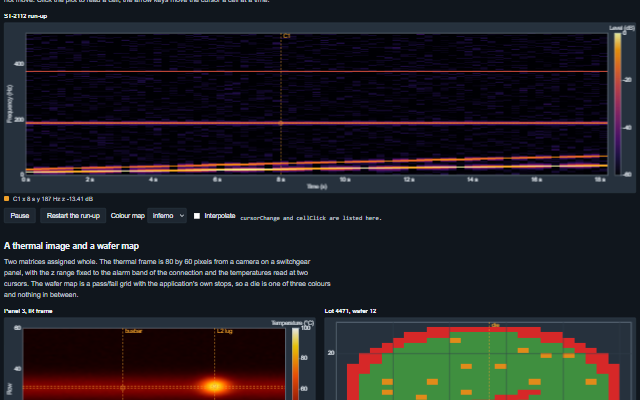
IntensityGraph displays a matrix as colour on an x and a y axis, with a colour ramp that says what the colours mean and cursors that read the cell under them: the display a spectrogram,…
<smart-digital-waveform>
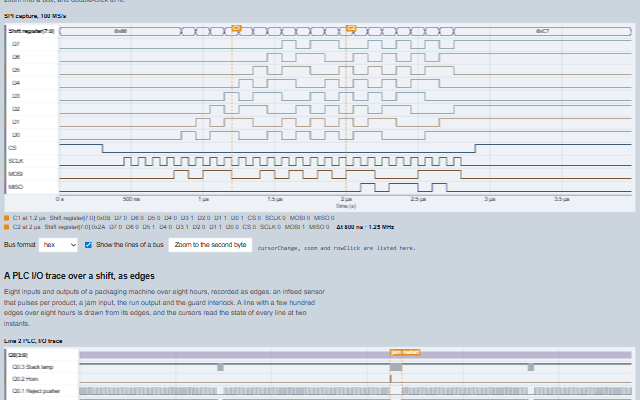
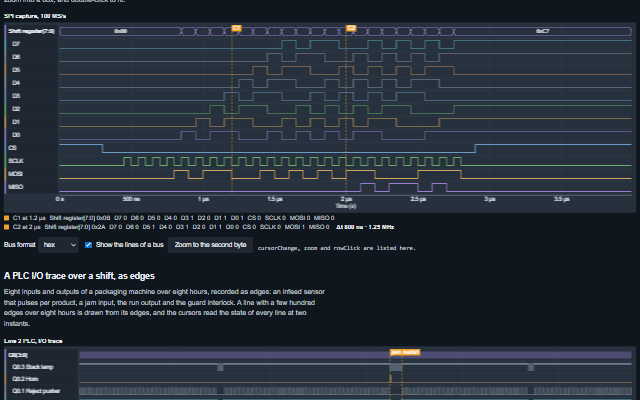
DigitalWaveform displays digital lines against time, one row per line, with lines grouped into buses whose words are written in hex, binary or decimal: the view of a logic analyser.
<smart-bode-plot>
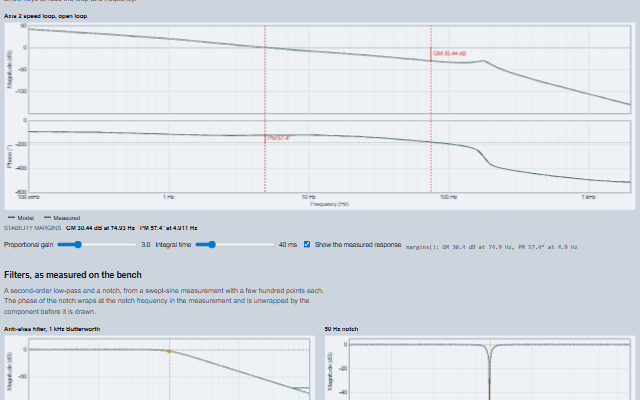
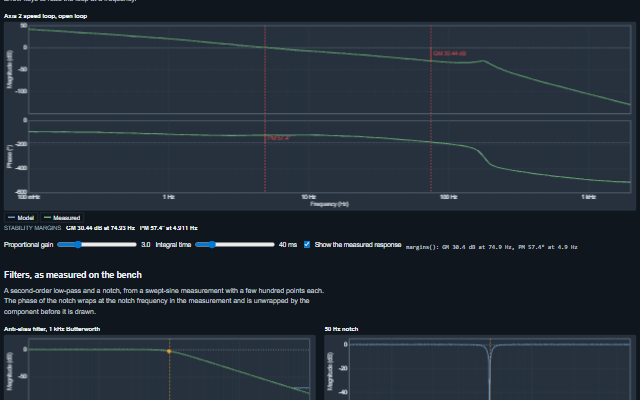
BodePlot displays magnitude and phase against a logarithmic frequency axis, one band above the other.
<smart-polar-plot>
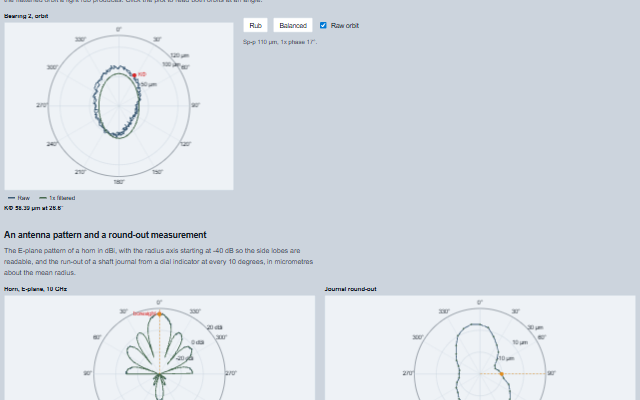
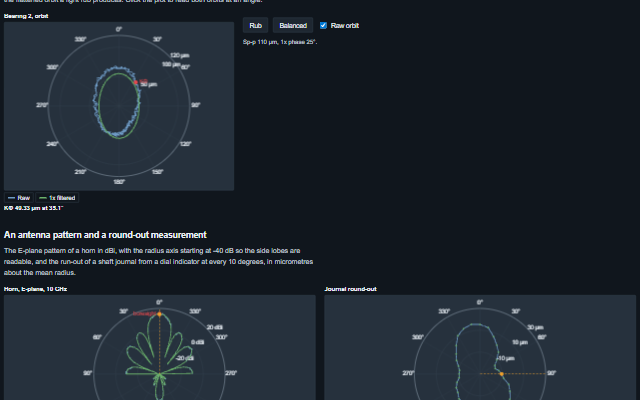
PolarPlot displays data on a circular grid: a radius against an angle, or an x and a y about a centre.
<smart-octave-bands>
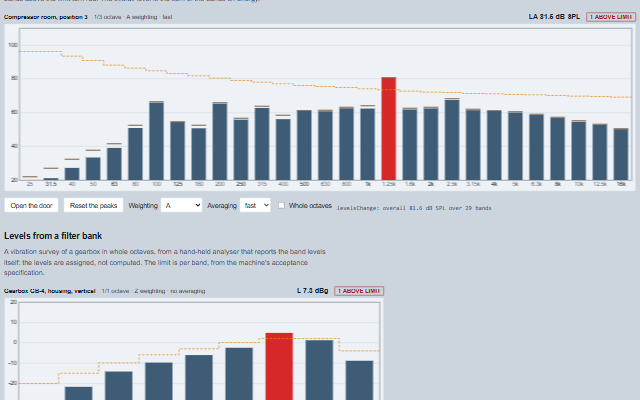
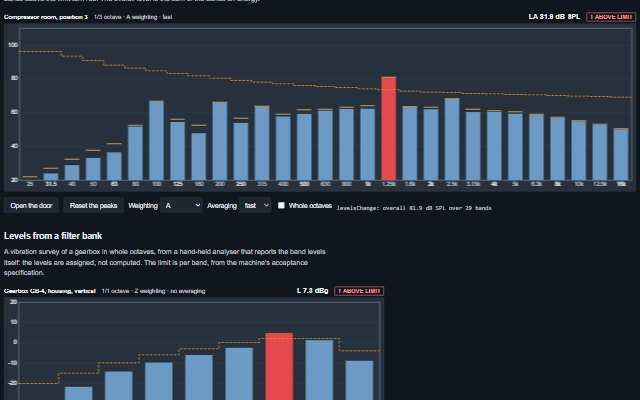
OctaveBands displays the level in each octave or third-octave band as a bar, with the frequency-weighted overall level and a limit curve the bands are checked against: the display of a…
<smart-resource-picker>
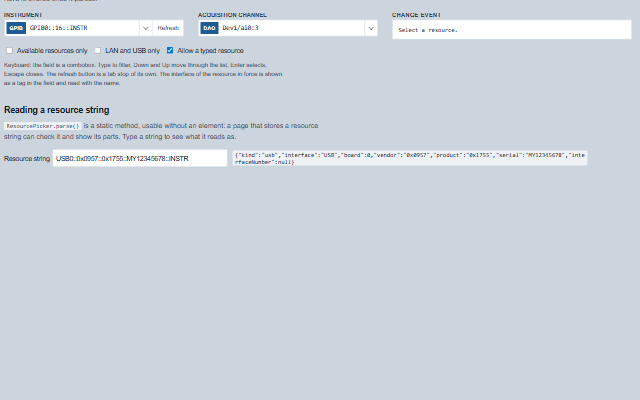
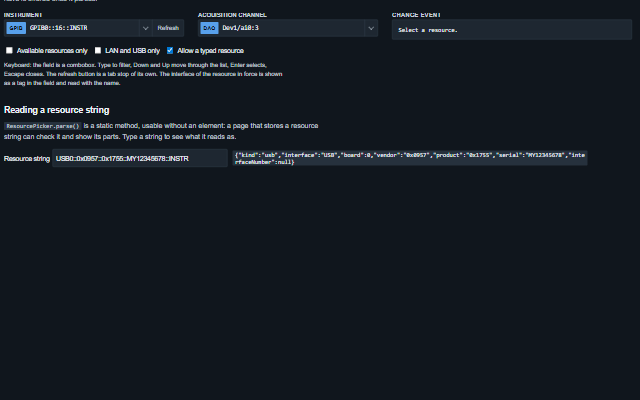
ResourcePicker selects an instrument or a channel: it lists the resources the application has found, grouped by interface and named by alias, filters them as text is typed, and reads a…
Complete screens built from the components. Each one lists the components it is built from and has its source on its page.
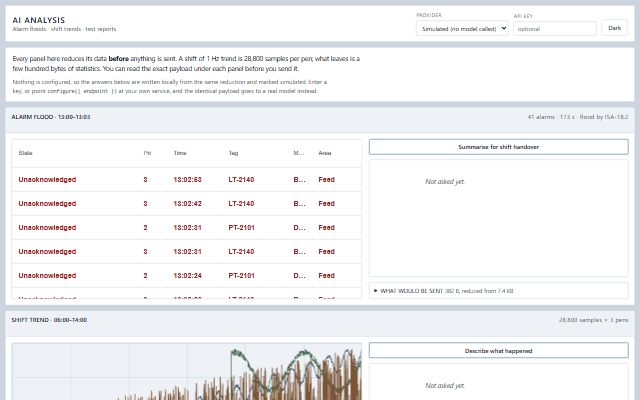
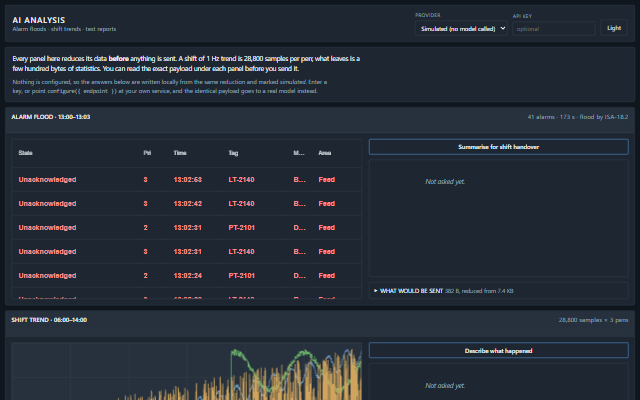
Alarm flood and trend analysis with the data reduction shown alongside the result.
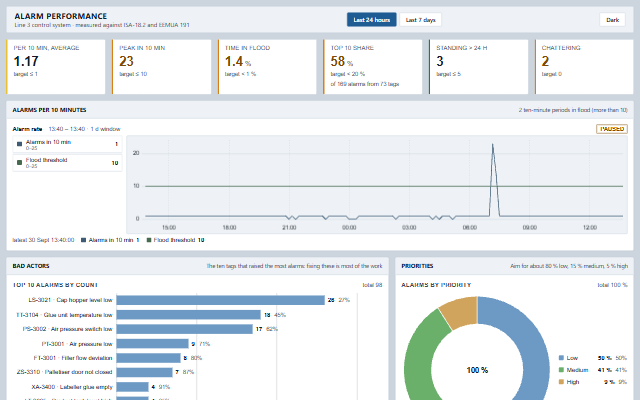
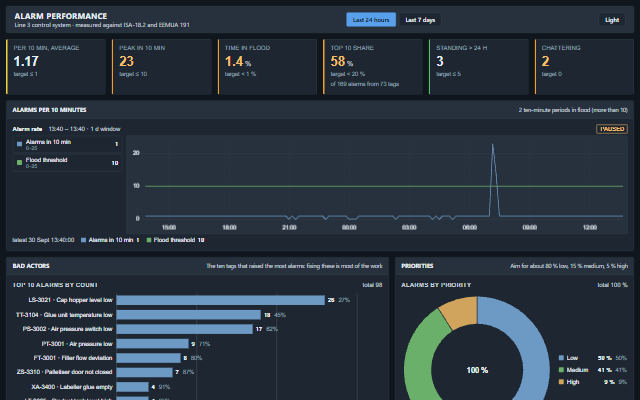
An alarm journal measured against ISA-18.2 and EEMUA 191: rate, floods, bad actors, priority mix, standing and chattering alarms.
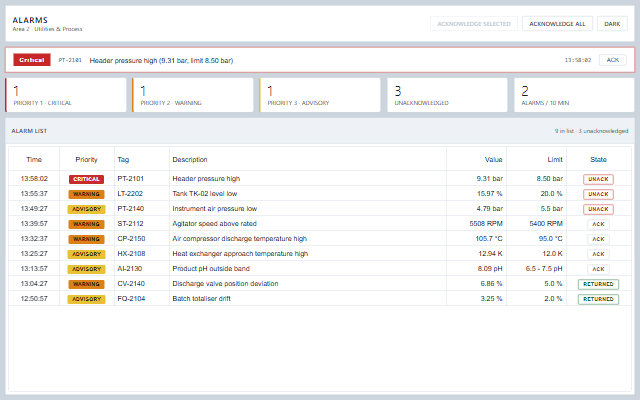
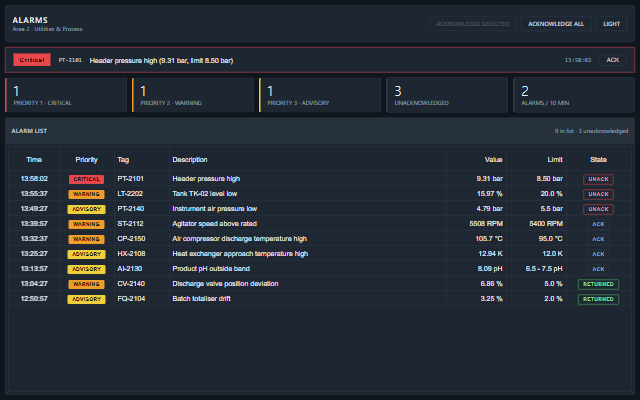
ISA-18.2 alarm management with an alarm summary, banner, shelving and alarm states.
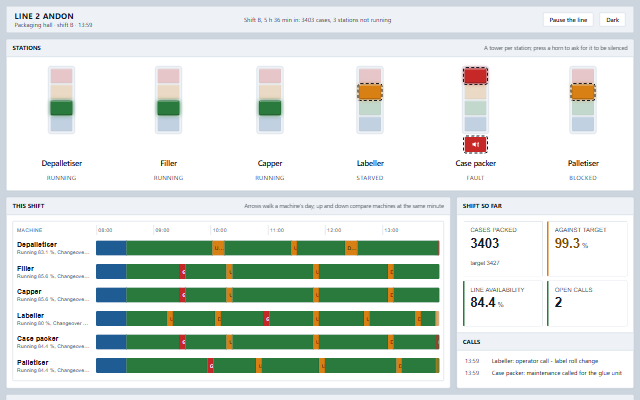
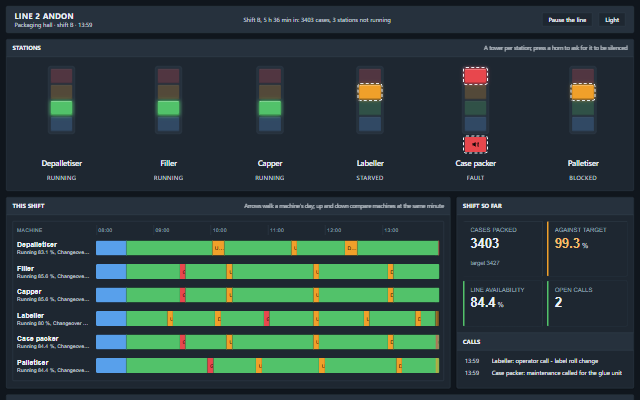
An andon board with a stack light per station, a state timeline for the shift, counts against target, calls and alarms.
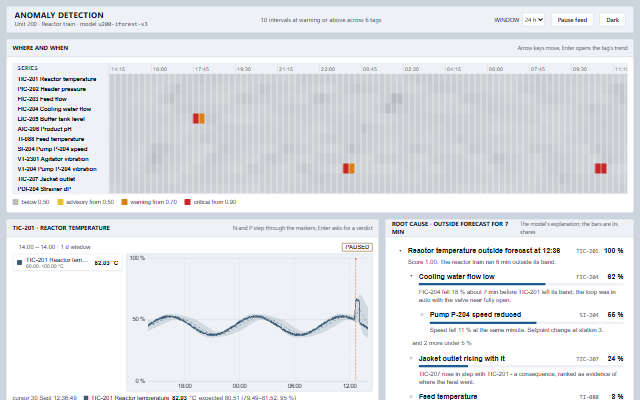
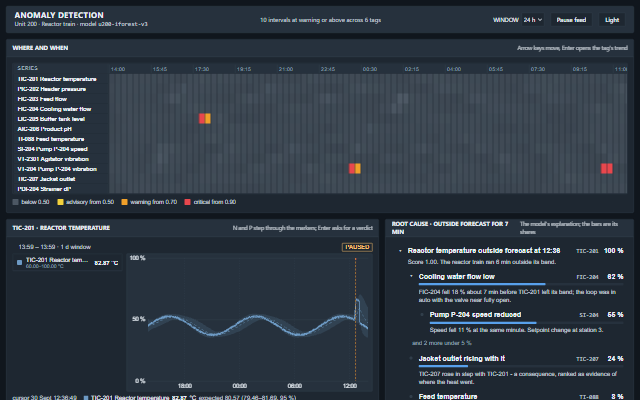
Anomaly detection with a heatmap of scores, forecast bands and markers on the trend, and a root-cause tree.
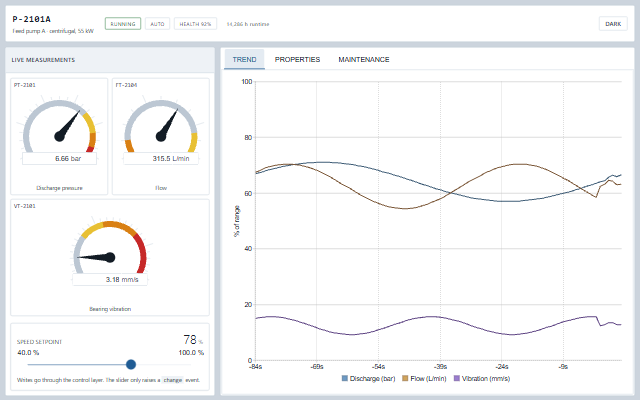
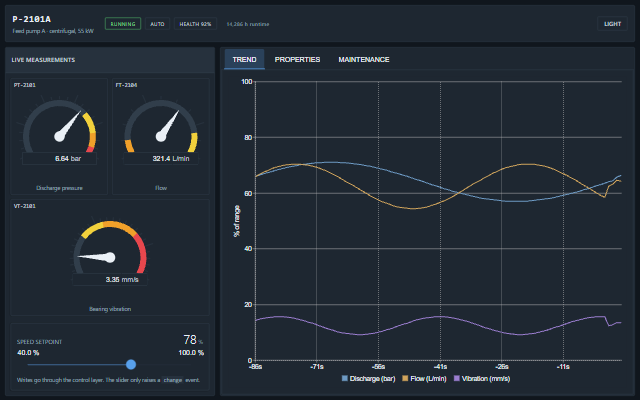
A single asset with vibration zones, a spectrum, permissives and its maintenance record.
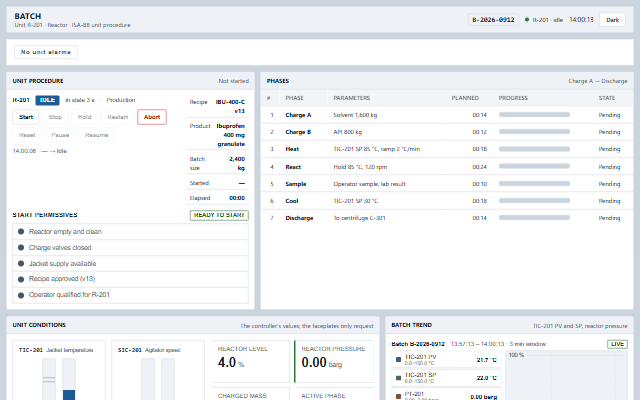
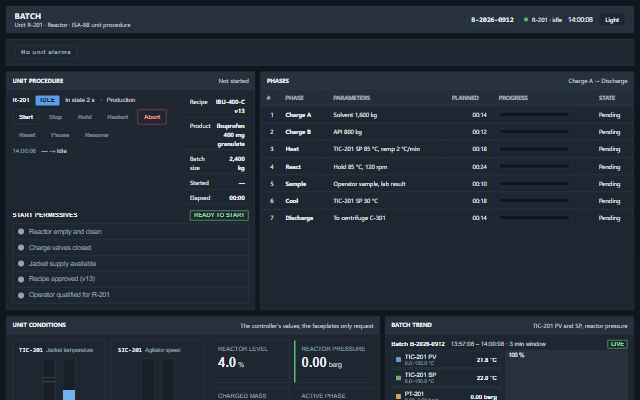
An ISA-88 unit procedure, the batch record and release with an electronic signature.
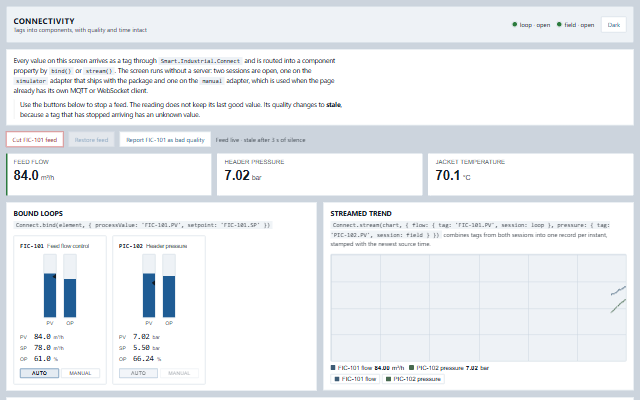
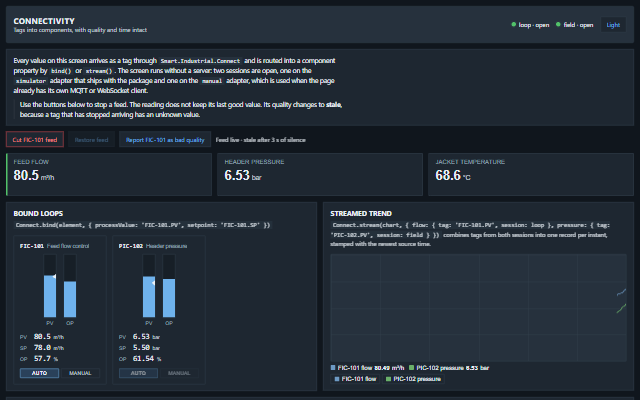
Two data sessions, a feed that stops, and how stale data is shown.
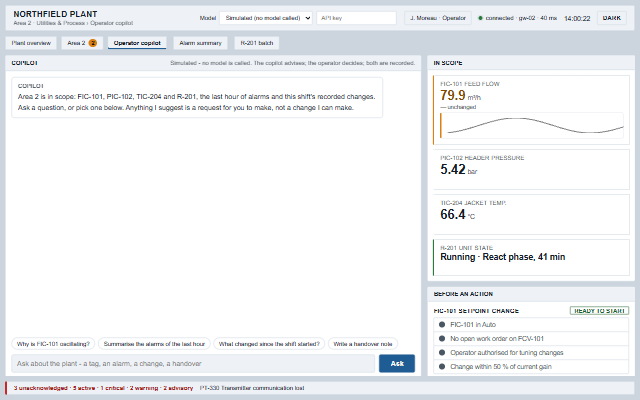
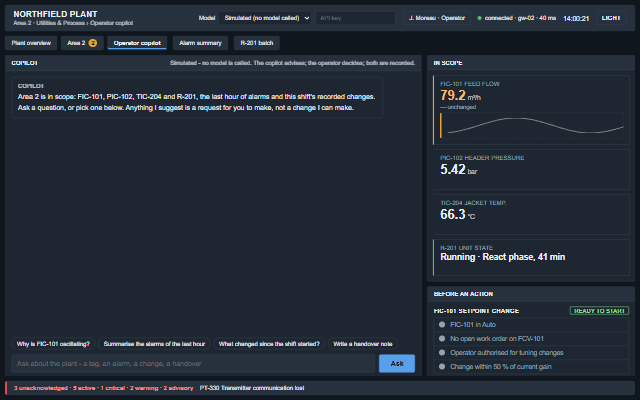
An operator assistant that turns suggestions into signed requests.
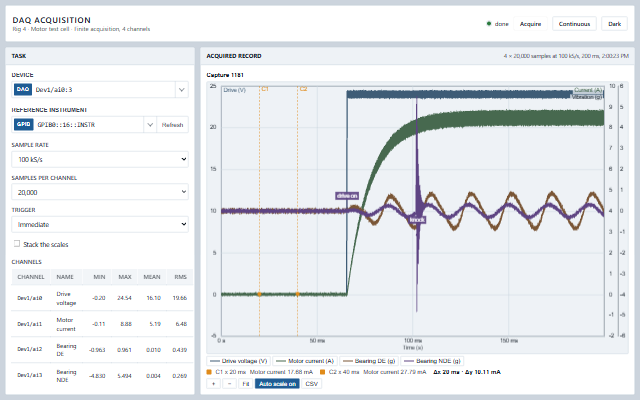
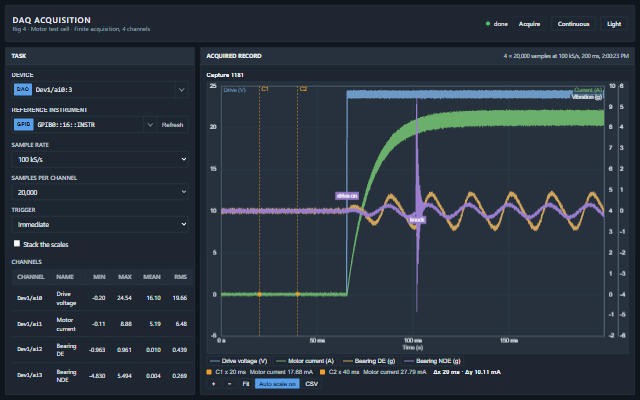
A data acquisition task: device and instrument pickers, a four-channel record on a waveform graph with cursors, and per-channel statistics.
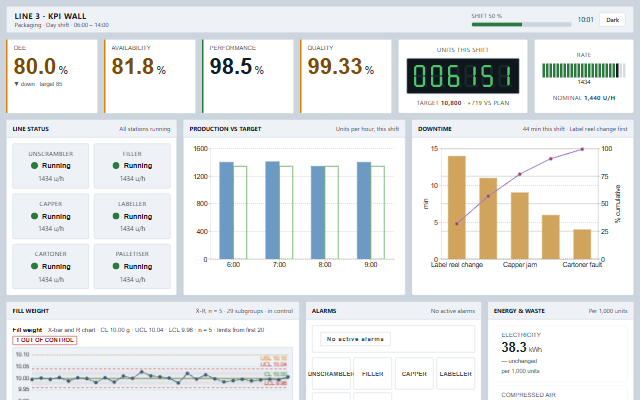
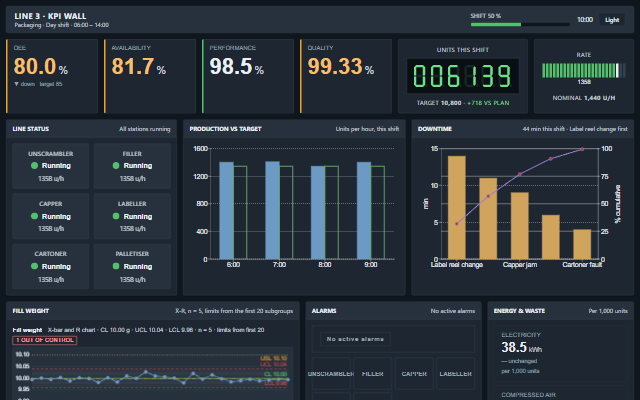
OEE, count against target, downtime Pareto, SPC and alarm KPIs on one display.
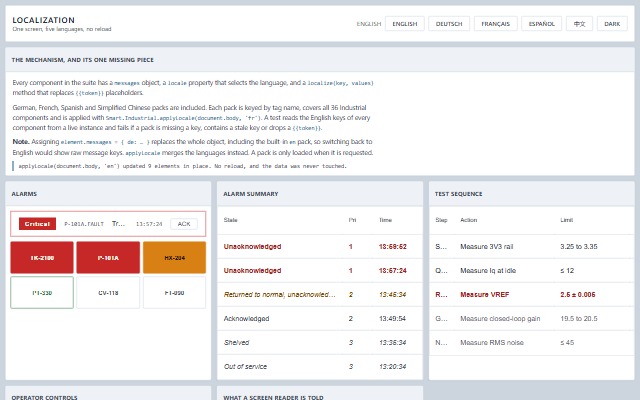
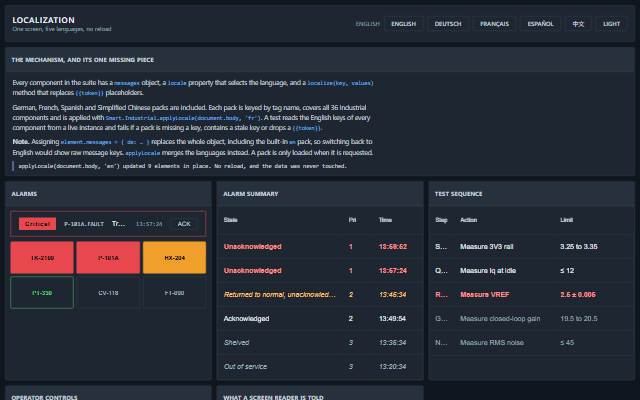
The same panels in five languages, switched at run time.
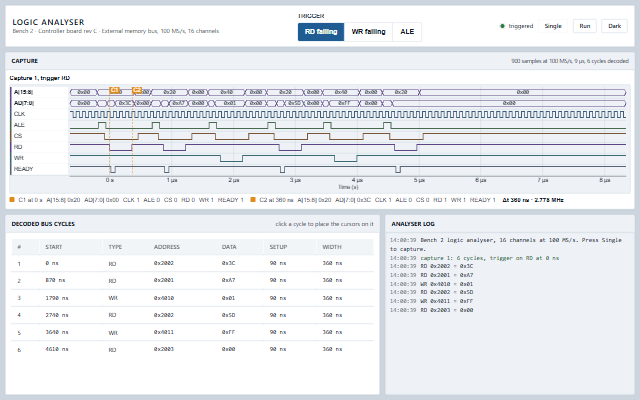
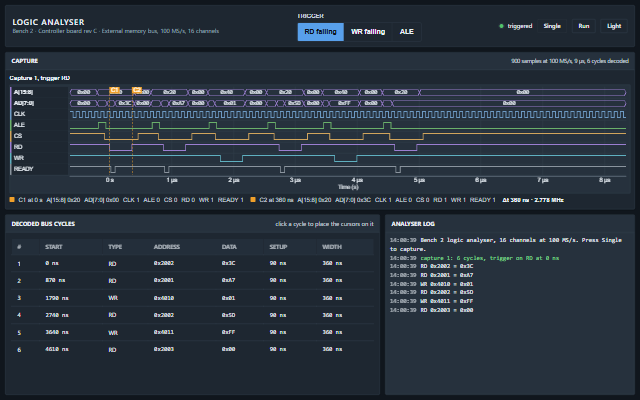
A logic analyser: a 16-channel capture of a memory bus with address and data buses decoded, cursors on a cycle and an analyser log.
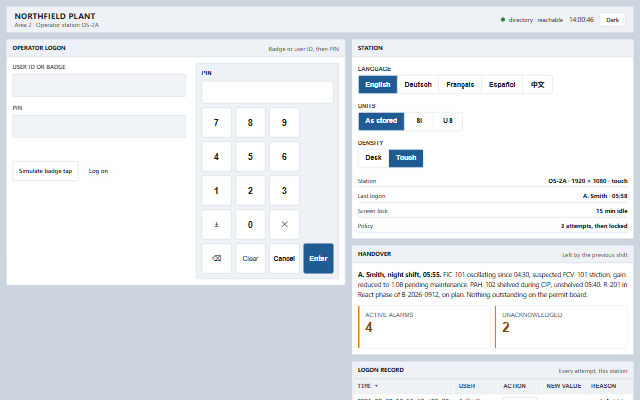
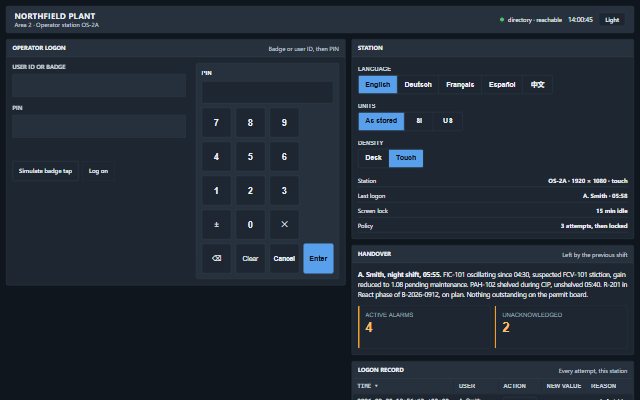
Badge and PIN login on a keypad with lockout, language and unit selection.
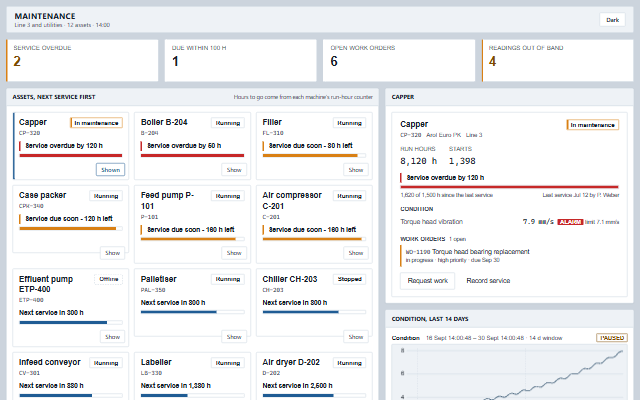
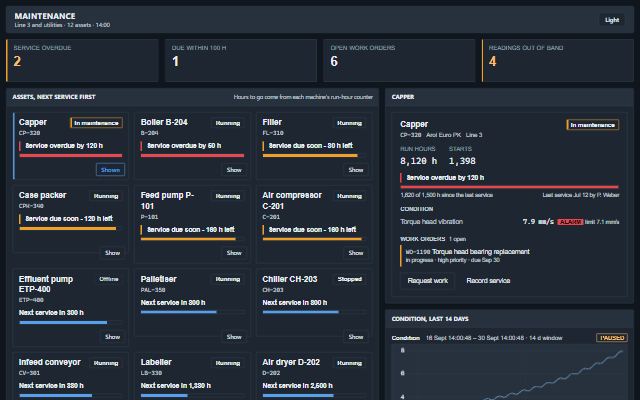
Every asset as a wall of cards ordered by service due in run hours, the chosen one with its condition, work orders and trend.
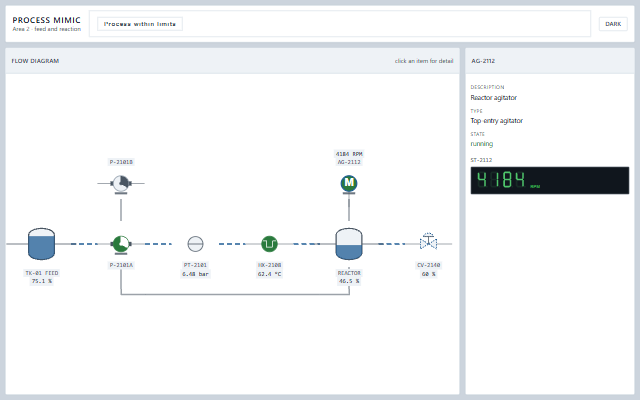
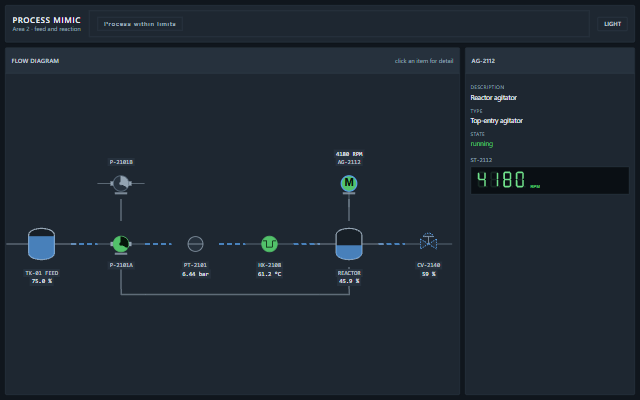
A process mimic with live symbols and pipes. Clicking a symbol opens its faceplate.
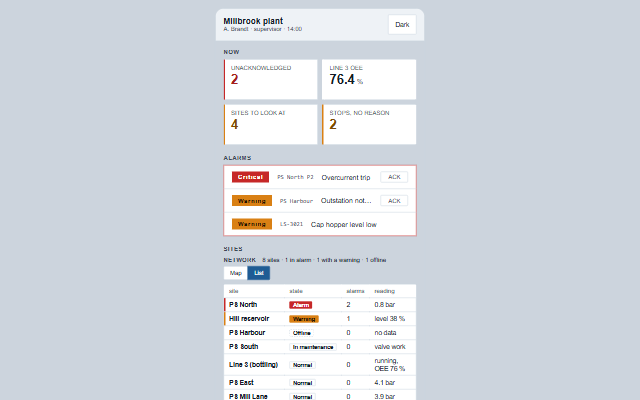
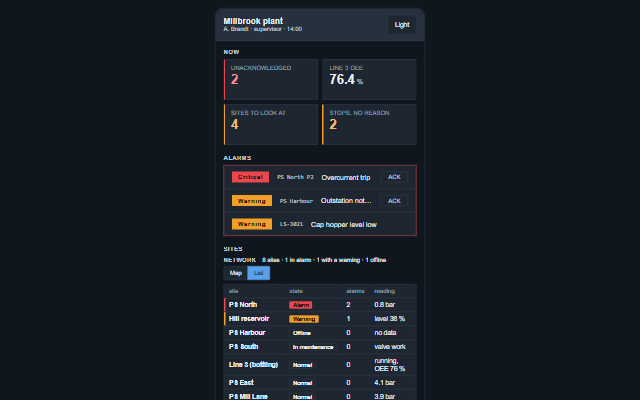
The plant at a phone's width: what needs someone, the alarms, the sites worst first, the line's order and the last handover.
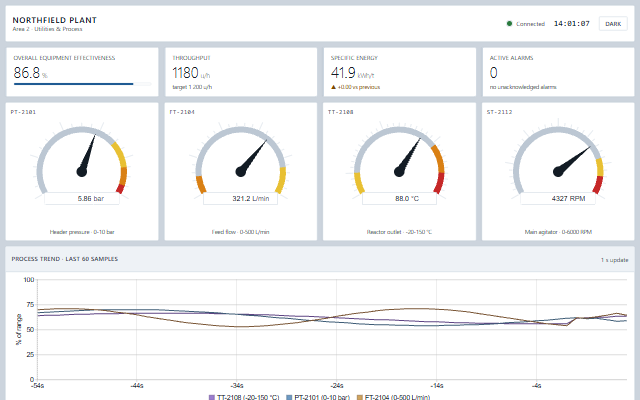
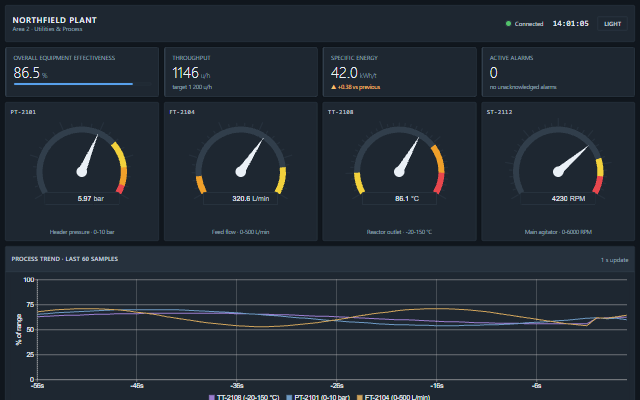
A plant overview display with unit status, key values and active alarms.
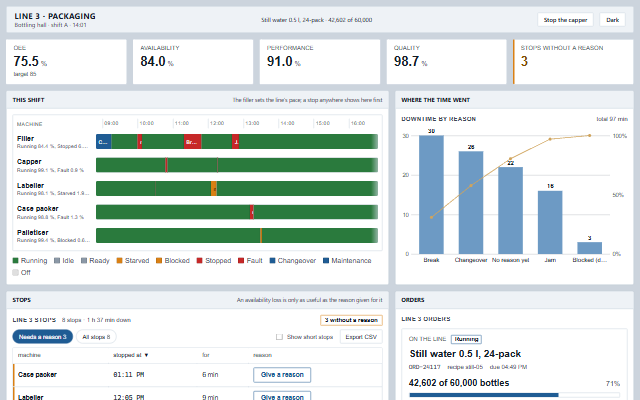
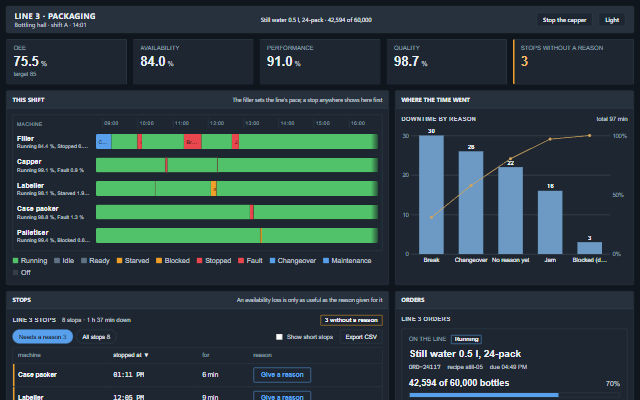
OEE with its three losses beside the shift timeline, the stops waiting for a reason, the downtime Pareto and the order on the line.
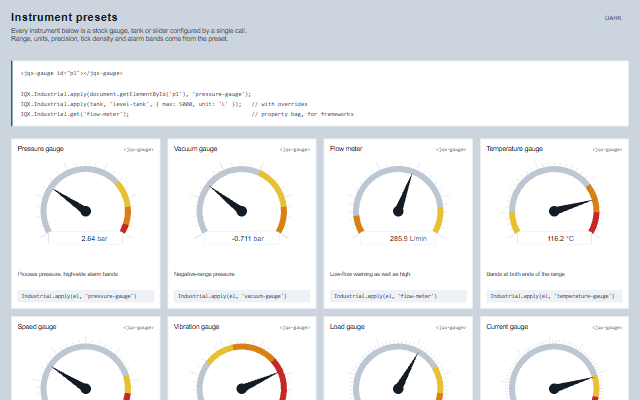
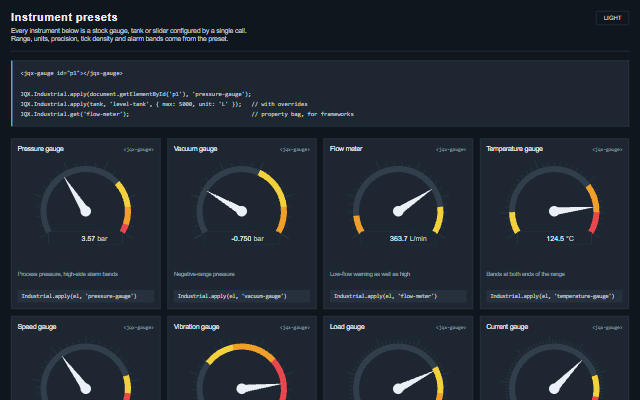
Instrument presets applied to gauges and tanks.
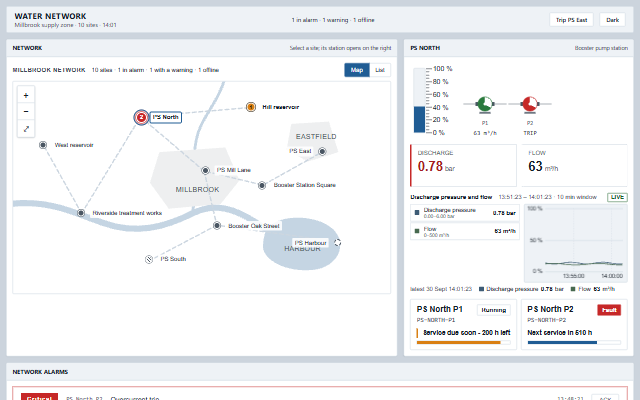
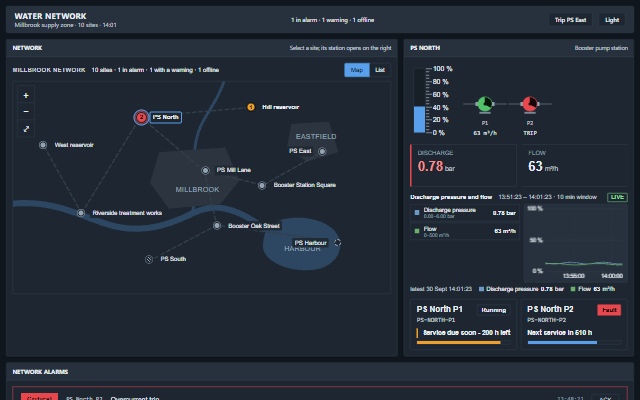
A water network on its own map, the selected pump station with its wet well, pumps, pressure and flow, and the network alarms.
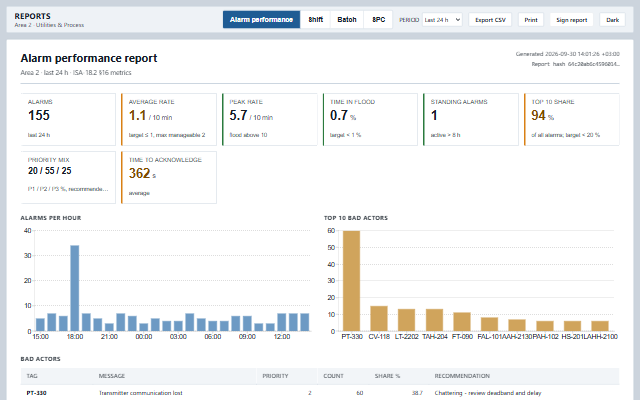
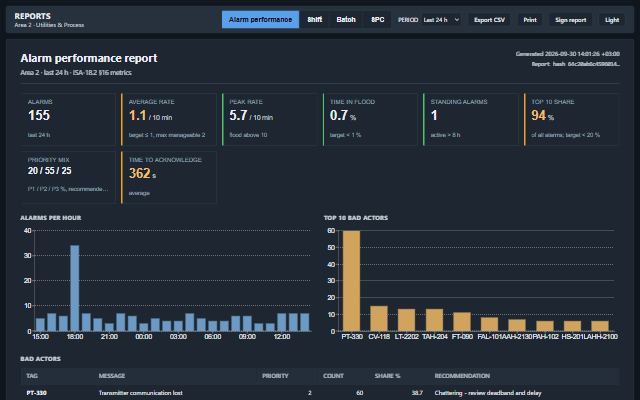
Alarm performance, shift, batch and SPC reports, printable and signed.
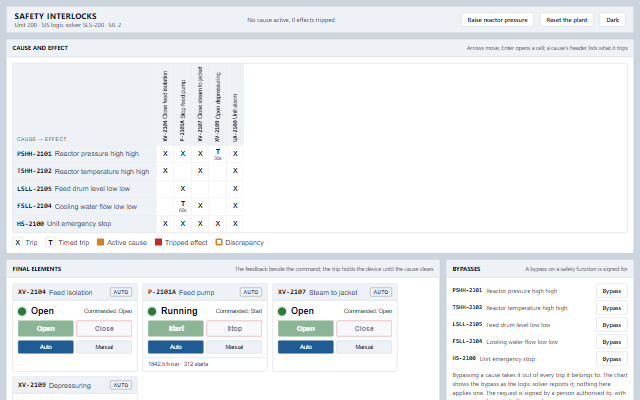
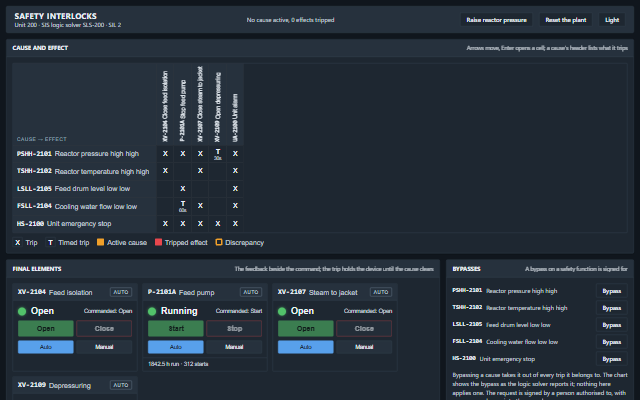
Safety interlocks with a live cause and effect matrix, device faceplates, bypasses under signature and the trip record.
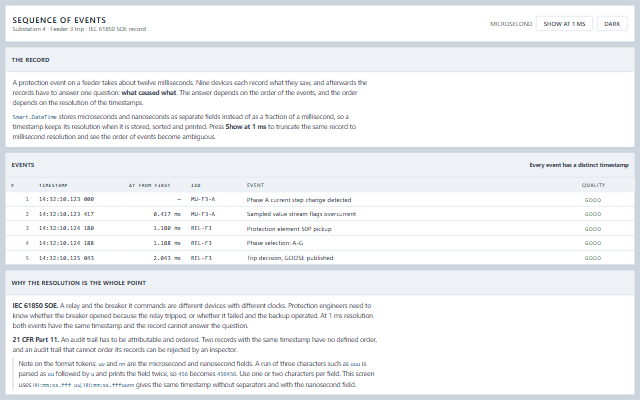
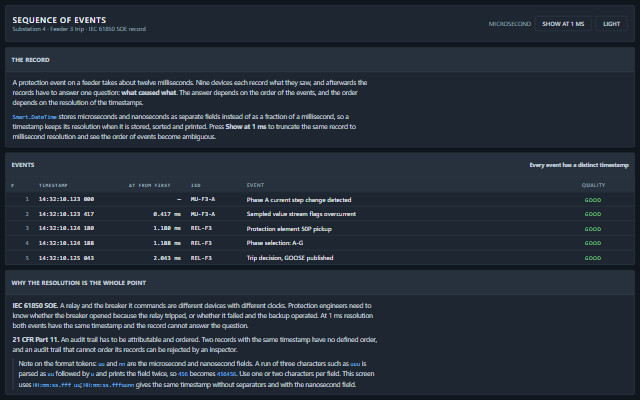
A substation trip recorded at microsecond resolution, in order.
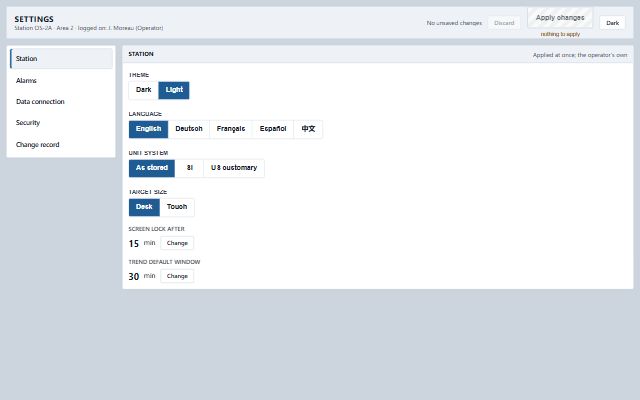
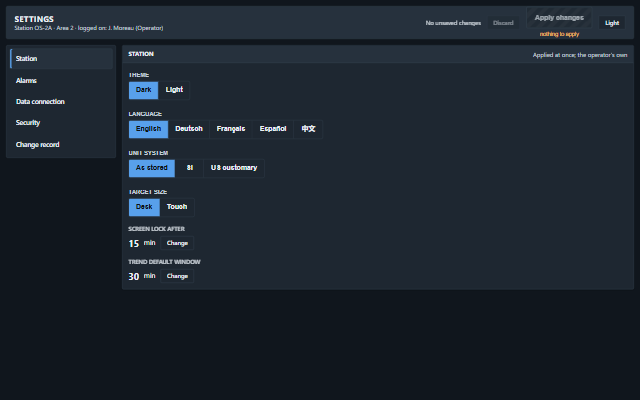
Station and plant settings with staged changes, supervisor signature and a change record.
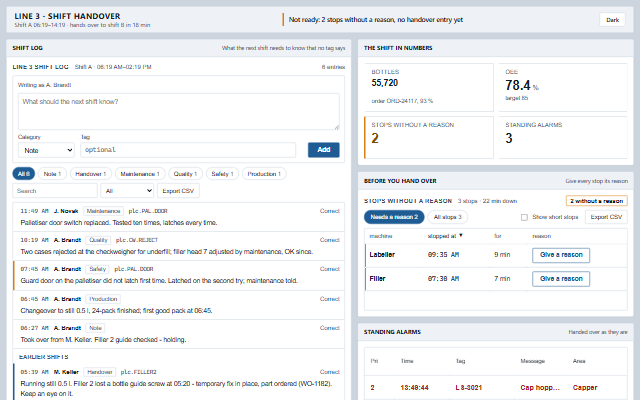
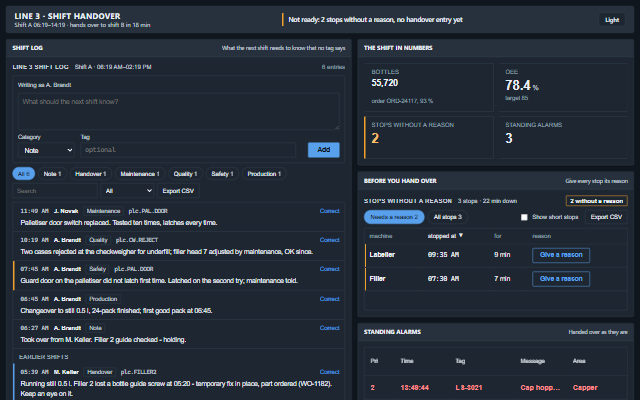
The shift log, the shift in numbers, the stops still without a reason, the standing alarms and the order, and whether the handover is ready.
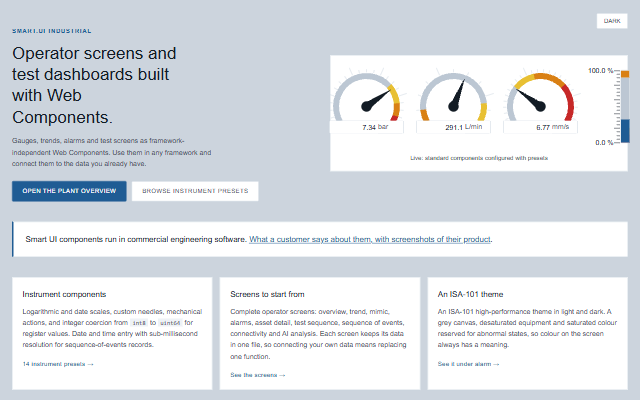
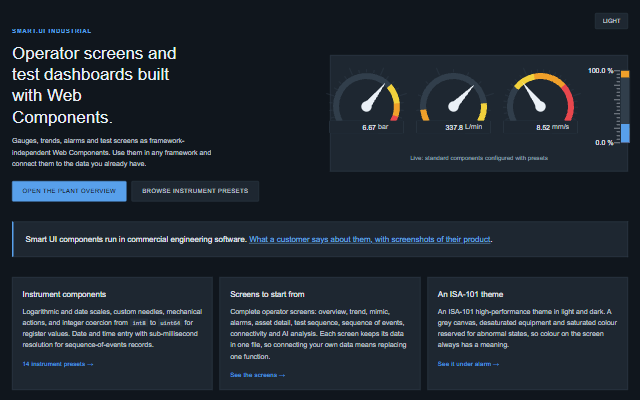
A process mimic, faceplates, a trend and the alarm list on one screen.
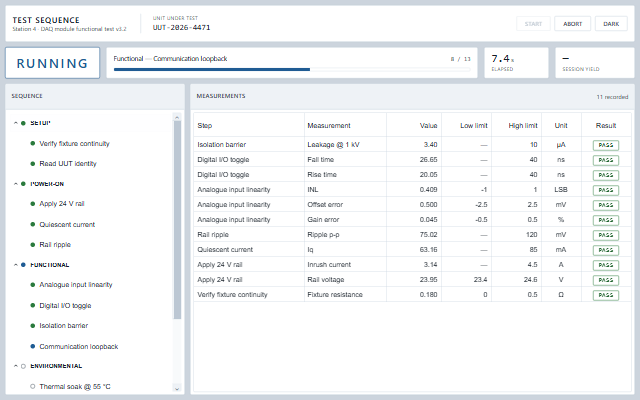
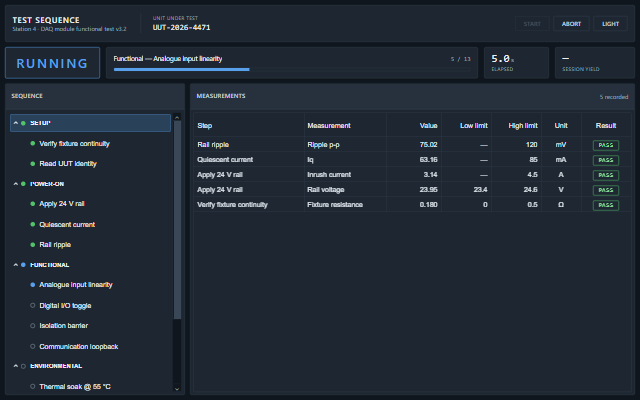
A test sequence with steps, limits, a run and its result record.
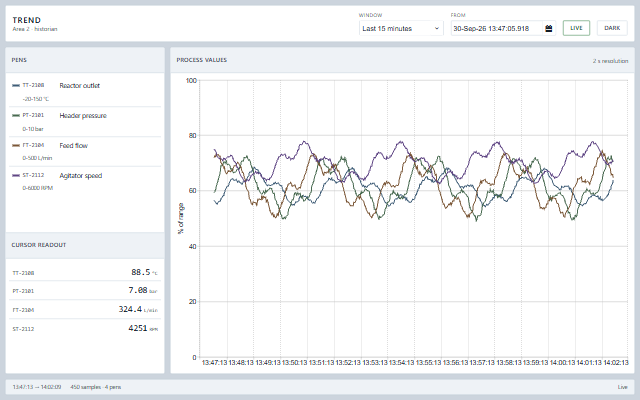
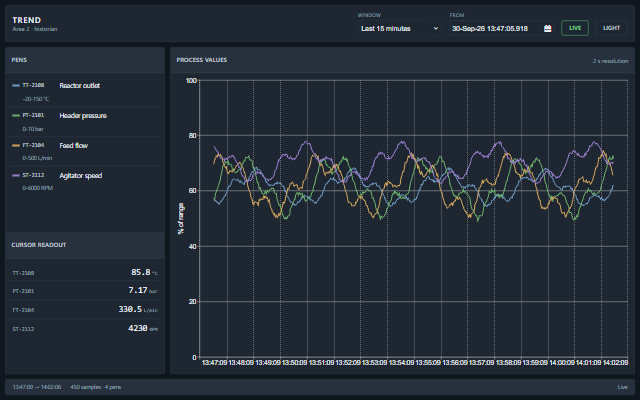
A historian trend with multiple pens, a cursor and history loaded on demand.
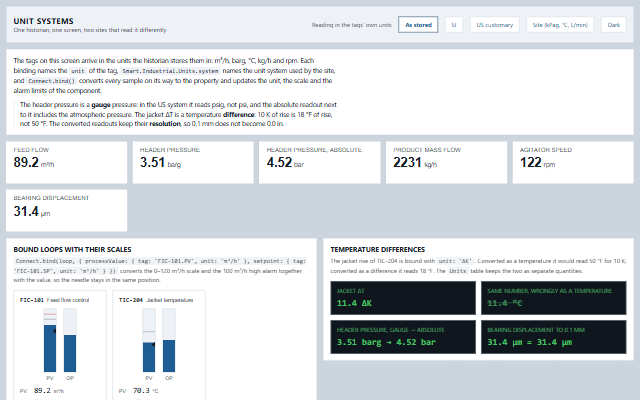
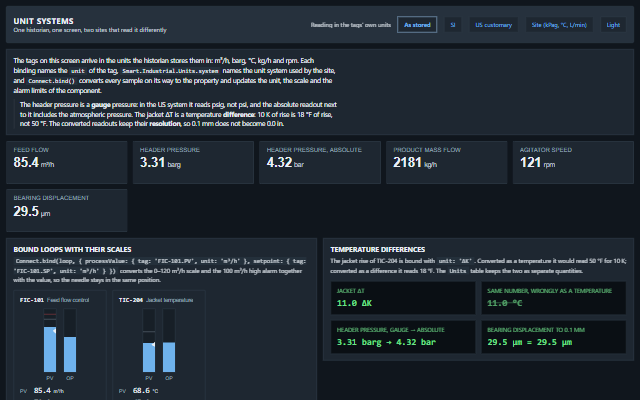
SI, US customary and a site-specific unit system on one screen.
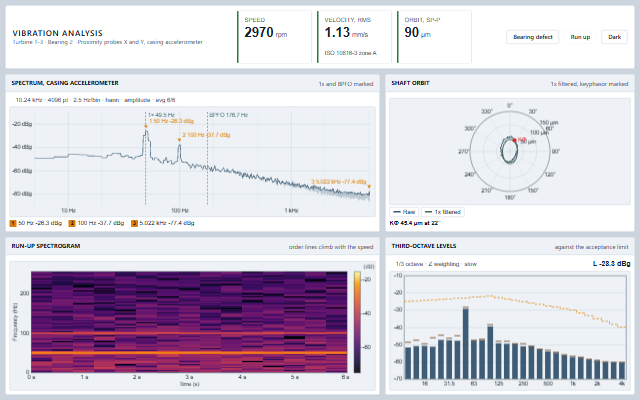
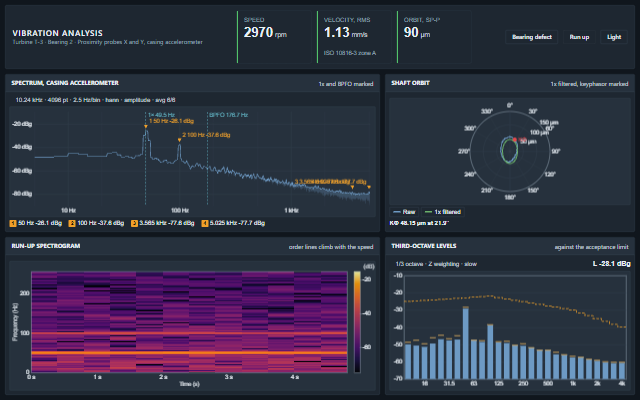
A bearing under analysis: spectrum with order markers, shaft orbit, run-up spectrogram and third-octave levels against a limit, with the ISO 10816-3 zone.