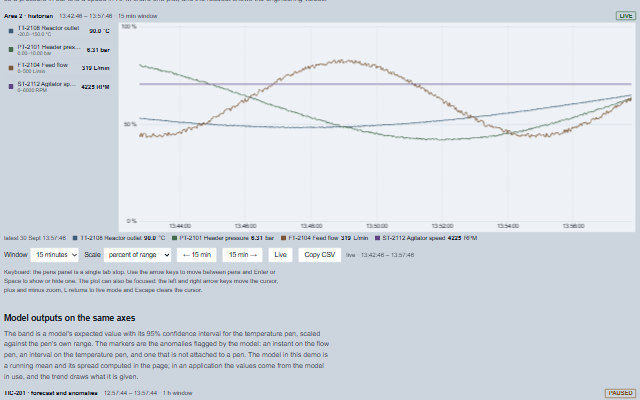
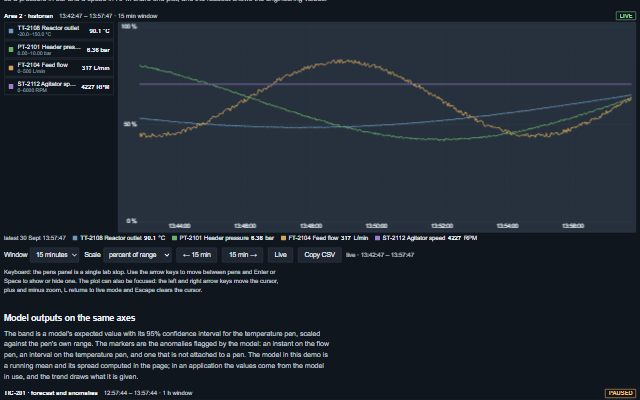
Trend is a historian trend chart for process data.
Pens are drawn against their own engineering ranges, the time axis can be panned and zoomed, a cursor reads the value of every pen at one instant, and live mode follows the newest sample. The component draws model outputs on the same axes: prediction bands with a confidence interval and anomaly markers with a severity and a score. History is supplied by the application; the historyRequest event is raised for time ranges the trend does not have, and Smart.Industrial.Connect.trend can answer it from a data session. Records are reduced to one column per pixel before drawing, and gaps longer than gapAfter are drawn as gaps.
English, German, French, Spanish, Chinese (locale packs)
In the demo: Four pens with live data and history · Model outputs on the same axes. Open the demo
Quick start
Install the package, load the two stylesheets and the component's module, and put the element on the page. The element below is the first one of the demo. Put the script after the module, in a <script type="module">, so that it runs once the component is defined.
const trend = document.getElementById('trend');

// raised when the window reaches a time before the earliest record held, once per interval
// rather than once per pixel of a drag
trend.addEventListener('historyRequest', (event) => {
    const { from, to, fields } = event.detail;
    // the component waits: carry out the request, then set the property from the result
});

// the same values as properties
trend.timeSpan = 900000;
trend.gapAfter = 10000;
trend.label = 'Area 2 · historian';
The properties the demo sets, then the next ones; the API page lists all 25 with their types and defaults.
Name
Type, default
Description
pens
array
Sets or retrieves the pens as [{ field, label, unit, min, max, color, visible, precision, quality, qualityField }]. field is the key under which each record carries the value; min and max are the engineering range the pen is scaled against, and a pen without them is scaled to the data on screen. quality is the tag's current quality - good, uncertain, bad or stale, or an OPC UA status code - and applies to the latest reading; qualityField names the record field that carries each sample's own quality (a word or a status code), read at the cursor too. A reading whose quality is not good says so beside the value, in the readout and in the accessible names. Items that are not objects, or have no field, are skipped. Assign a new array to update the component.
data
array
Sets or retrieves the records held by the trend as { timestamp, field: value, .. }, in time order. Assigning the property replaces the records; push and pushMany add to them. A record without a timestamp is stamped with the current time.
bands
array
Sets or retrieves the prediction bands, one per pen, as [{ field, label, confidence, color, records }], where records is [{ timestamp, expected, lower, upper }] in time order and confidence is the confidence level as a fraction (0.95 for a 95% interval). A band is drawn under its pen and scaled against the pen's range, and the readout shows the expected value and the interval at the cursor. The model that produces the band is part of the application. Assign a new array to update the component.
markers
array
Sets or retrieves the anomaly markers as [{ id, field, timestamp, timestampEnd, severity, score, label, description }]. severity is advisory, warning or critical (other values are treated as warning) and score is the model's confidence from 0 to 1, shown with the marker. A marker with a field is placed on that pen's line; a marker without a field spans the plot. A marker with a timestampEnd is an interval and is drawn as a band of time. Markers can be stepped through with N and P, are read out at the cursor, and are reported by the markerClick event. Assign a new array to update the component. Items that are not objects (null, for example) are skipped with a console warning.
showBands
boolean true
Determines whether the prediction bands are drawn and read out. The bands are kept either way.
timeSpan
number 900000
Sets or retrieves the window's width in milliseconds.
live
boolean true
Determines whether the window follows the newest sample. Dragging, zooming, setWindow and pan turn it off; goLive turns it back on.
scaleMode
string percent
Sets or retrieves how the pens share the plot. percent draws every pen from 0 to 100% of its own range, as a historian does, which compares signals by shape; value draws all pens on one axis in engineering units, from min to max or from the data, for pens that share a unit.
min
number
Sets or retrieves the bottom of the shared value axis in value mode. null follows the data.
max
number
Sets or retrieves the top of the shared value axis in value mode. null follows the data.
gapAfter
number
Sets or retrieves the maximum interval between two samples, in milliseconds, before the line is broken between them and valueAt returns NaN inside the gap. null (the default) works it out from the data: five times the median interval between records, so a late or missed poll is still joined and an outage is a gap, not a slope. 0 never breaks the line. With historian data that is stored on change (compressed), where long intervals are normal, set it to the longest interval that is not an outage, or 0. NaN or a negative value is ignored with a console warning and the interval is worked out from the data.
label
string
Sets or retrieves the trend's name, shown in the header and in the accessible name.
The events carry their data in event.detail. The trend moves its own window, cursor or pen visibility and then raises windowChange, cursorChange or penVisibilityChange; pointer and keyboard input count only while interactive is true. historyRequest is a request for older samples that the application answers with pushMany(), and markerClick reports the marker under the cursor.
Event
Description and detail
windowChange
This event is triggered when the interval on screen changes, by a drag, a zoom, a pan, setWindow, goLive, or a new sample while live.
fromnumber The window's start, as a timestamp. tonumber The window's end, as a timestamp. liveboolean Whether the window follows the newest sample.
historyRequest
This event is triggered when the window reaches a time before the earliest record held, once per interval rather than once per pixel of a drag. The application responds with pushMany; Smart.Industrial.Connect.trend responds from the history of a session.
fromnumber The start of the interval needed, as a timestamp. tonumber The end of the interval needed, the earliest record held, or the window's end. fieldsany[] The pens' fields.
cursorChange
This event is triggered when the cursor is placed, moved or cleared through the pointer or keyboard.
timenumber The cursor's timestamp, or null when cleared. valuesobject Every pen's value at the cursor, keyed by field; NaN where there is none.
markerClick
This event is triggered when a marker is clicked, or Enter is pressed with the cursor on one. The cursor has already moved to the marker. A host that wants the operator's verdict on the model, a true or a false positive, asks for it here.
markerobject The marker, as it was given. timenumber The time under the pointer or cursor.
penVisibilityChange
This event is triggered when a pen is shown or hidden from the pens panel or through togglePen.
indexnumber Which pen. fieldstring The pen's field. visibleboolean Whether it is now drawn.
Methods
Method
Description
push(record) returns boolean
Appends one record and redraws. Returns false when there was nothing to add.
pushMany(records) returns boolean
Appends a batch of records, either live samples or a page of history, merged in time order, so that history arriving after live samples is placed correctly. Returns false when there was nothing to add.
clear()
Removes every record.
snapshot() returns array
Returns a copy of the records held, oldest first.
valueAt(field, time) returns number
Returns a pen's value at an instant, interpolated between the samples either side, or NaN outside the record, inside a gap (two samples further apart than gapAfter, or than the interval worked out from the data when gapAfter is null), next to a sample with no reading, or for a pen with no samples.
bandAt(field, time) returns any
Returns the expected value and interval of a band for a pen at a time, interpolated between the two band records on either side, as { expected, lower, upper, confidence, label }, or null when the pen has no band at that time.
markersAt(time) returns any[]
Returns the markers at a time: an interval marker that contains the time, or an instant marker within one pixel column of it, so that a cursor placed with the pointer selects the marker.
nextMarker() returns any
Moves the cursor to the next marker on screen after the cursor (or to the first marker when there is no cursor or the cursor is past the last one), announces it and returns it. Returns null when there are no markers on screen.
previousMarker() returns any
Moves the cursor to the previous marker on screen, wrapping to the last one, announces it and returns it. Returns null when there are no markers on screen.
toCSV() returns string
Returns the visible window as CSV, an ISO timestamp column and one column per visible pen, for a spreadsheet.
goLive()
Returns to live mode and follows the newest sample.
setWindow(from, to)
Shows the given time interval and leaves live mode.
zoom(factor, around?)
Zooms the window by a factor, keeping one time in place, and leaves live mode.
pan(delta)
Moves the window by a time interval and leaves live mode. The window stops at the newest sample.
togglePen(index, visible?)
Shows or hides one pen and raises the penVisibilityChange event.
invalidate()
Redraws the plot on the next animation frame, so that many pushes between two frames cost one draw.
In Angular, React, Vue and Blazor
The same element with its wrapper. Each page has the installation steps and the full demo in that framework.
The Trend is drawn on a canvas, which is not accessible to a screen reader. Everything drawn on the canvas is therefore also available as text: the header contains the displayed interval and whether the trend is live; the pens panel contains the label, range and value of every pen; and the readout contains the cursor time and the value of every pen at that time, plus the expected value and interval of a model band and the marker under the cursor, named by severity, label and score. The pens panel is a composite widget with one tab stop and arrow key navigation, and the plot itself can be focused, so the cursor, the zoom and the return to live mode are available from the keyboard.
Roles: "group""application""list"
Key
Action
Tab
Moves into the pens panel, landing on the pen that holds the tab stop, then to the plot, and out again. The panel is one stop however many pens there are.
Arrow Up/Down
In the pens panel, moves between the pens.
Home / End
Moves to the first / last pen.
Enter or Space
In the pens panel, shows or hides the focused pen, raising penVisibilityChange.
Arrow Left/Right
On the plot, moves the cursor by one pixel's worth of time; with Shift, by ten. Home and End put it at the window's edges. Raises cursorChange.
+ / -
On the plot, zooms in or out around the window's centre, leaving live mode.
L
On the plot, returns to live.
N / P
On the plot, moves the cursor to the next / previous anomaly marker on screen, wrapping, and announces it, its severity, label and score, through the live region. The readout names the marker under the cursor in text.
The component follows the theme on the page: the default theme, or the ISA-101 light and dark themes that ship with the package. It declares 4 CSS variables of its own, among them --smart-trend-height, --smart-trend-pens-width, --smart-trend-plot-background, --smart-trend-grid-color. The CSS page lists them; the themes guide covers the tokens every component shares.