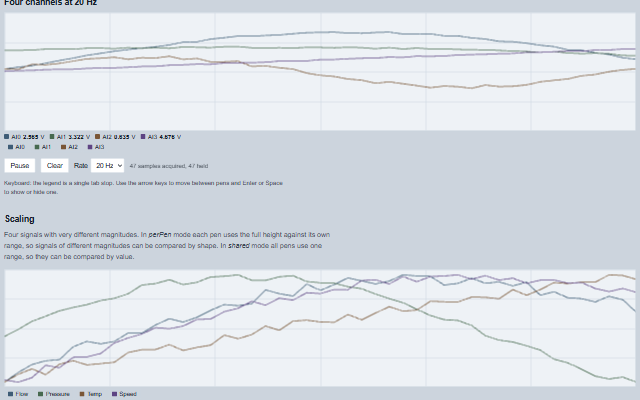
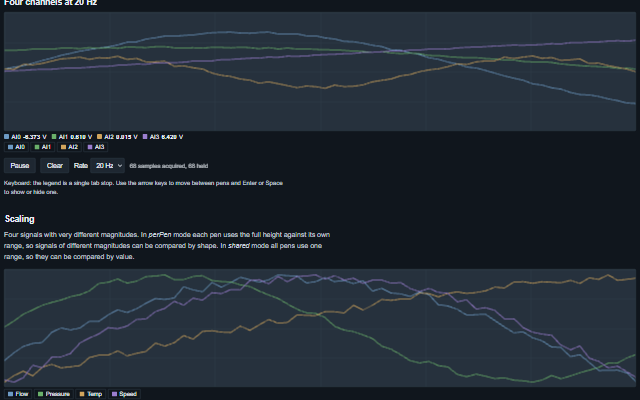
StripChart is a real-time chart for continuously acquired samples: the newest sample is drawn at the right and the oldest leaves at the left.
Samples are pushed into a ring buffer and drawing is batched per animation frame, so the chart can accept samples at high rates. It is intended for data acquisition from a WebSocket, an OPC UA subscription or a DAQ callback. For historian data at low rates, use the Trend component.
English, German, French, Spanish, Chinese (locale packs)
In the demo: Four channels at 20 Hz · Scaling · Modes · and more. Open the demo
Quick start
Install the package, load the two stylesheets and the component's module, and put the element on the page. The element below is the first one of the demo. Put the script after the module, in a <script type="module">, so that it runs once the component is defined.
The properties the demo sets, then the next ones; the API page lists all 18 with their types and defaults.
Name
Type, default
Description
autoScale
string none
Sets or retrieves how the vertical range is chosen.
historyLength
number 1000
Sets or retrieves the number of samples the ring buffer holds, from 2 to 1 000 000. A larger value (Infinity included) holds 1 000 000; NaN or a negative value is ignored with a console warning and the buffer is kept. Changing it to another size creates a new buffer and discards the samples held.
max
number 100
Sets or retrieves the top of the vertical range, for pens that do not set their own. Ignored unless autoScale is none.
min
number 0
Sets or retrieves the bottom of the vertical range, for pens that do not set their own. Ignored unless autoScale is none.
mode
string scroll
Sets or retrieves how new samples move across the display.
paused
boolean false
Sets or retrieves whether the chart is frozen. A paused chart keeps what it holds and drops anything pushed at it, and push returns false so the application knows the sample was not taken.
pens
array
Sets or retrieves the channels to draw as [{ field, label, unit, color, min, max, visible }]. field is the key under which each sample carries the value; the other members are presentation. With autoScalenone, min and max are the pen's scale: a reading beyond them is kept as it is in the digital display, flagged OVER or UNDER beside it and in the chart's accessible name, and its trace is pinned to the edge it left by. An item that is not an object (null, for example) is skipped with a console warning. Assign a new array to update the component; an array modified in place is deep-equal to the current one and does not trigger a redraw.
precisionDigits
number 2
Sets or retrieves how many decimal places the digital readout shows, from 0 to 20; a value outside that is clamped, and one that is not a number shows 2.
showDigitalDisplay
boolean false
Sets or retrieves whether the latest value of each pen is shown as a number above the legend. A sample with no reading for a pen - a missing, null, empty, non-numeric or infinite value - shows "--" (said as "no reading"), never 0; a reading off a fixed scale shows its real value with an OVER or UNDER flag.
showScales
boolean false
Sets or retrieves whether the scales are drawn: a y scale down the left of the plot with a label at every grid row, read on the first pen's range (the shared range, or min and max; with perPen scaling among several pens the labels take the first pen's colour), and an x scale along the bottom with a label at every grid column - seconds before now on a time axis, sample numbers otherwise. A classic waveform chart has both; the plot gives up the margins they take and is clipped to them.
showLegend
boolean true
Sets or retrieves whether the pen legend is shown. The legend is a composite widget: it is one tab stop for the whole group, arrowed between, with Enter or Space showing and hiding a pen.
timeSpan
number 60000
Sets or retrieves how much time the width covers, in milliseconds, when xAxisMode is time. A value that is not a positive number draws 60 000.
xAxisMode
string sample
Sets or retrieves what the horizontal axis represents: the sample index or the sample time.
The events carry their data in event.detail. pointsAppended and overflow report samples the strip chart has already stored, and samples pushed while paused is true are dropped and raise nothing. penVisibilityChange follows a pen the chart has already shown or hidden in pens.
Event
Description and detail
overflow
This event is triggered once per overflow episode: when the ring buffer is full and the first samples are overwritten. It is raised again only after the buffer has been emptied - by clear() or a historyLength change - and has filled again, not on every push while the buffer stays full.
droppednumber How many samples the push that started the episode overwrote. capacitynumber The buffer's size.
penVisibilityChange
This event is triggered when a pen is shown or hidden, whether from the legend or from togglePen.
indexnumber The pen's position in the pens array. fieldstring The pen's field. visibleboolean Whether the pen is now drawn.
pointsAppended
This event is triggered when samples are appended.
appendednumber How many samples were taken. lengthnumber How many the buffer now holds. writtennumber How many have been written since the buffer was created, which keeps counting past the buffer's capacity.
Methods
Method
Description
clear()
Empties the buffer and redraws. The next time the buffer fills, overflow is raised again.
invalidate()
Marks the chart as needing a redraw and redraws it on the next animation frame, so that many pushes between two frames cost one draw. The method is called by push, so an application rarely needs to call it.
push(sample) returns boolean
Appends one sample and schedules a redraw. A pen whose field is missing, null, empty, non-numeric or infinite has no reading at that sample: its trace has a gap there and the digital display shows "--", never 0. Returns false if the chart is paused, or the sample is not an object, and the sample was dropped.
pushMany(samples) returns boolean
Appends a batch of samples with one redraw for the whole batch, so a block read from a DAQ card costs the same as one sample. Items that are not objects (null, for example) are skipped. Returns false when the chart is paused, or no item was a sample, and the batch was dropped.
snapshot() returns object[]
Returns the samples in the buffer, oldest first, as a new array. The array is a copy, so it can be passed to an exporter or kept without being changed by later pushes.
togglePen(index, visible?)
Shows or hides one pen.
In Angular, React, Vue and Blazor
The same element with its wrapper. Each page has the installation steps and the full demo in that framework.
The StripChart is drawn on a canvas, which is not accessible to a screen reader. The component names what it is trending, and its pen legend is a composite widget with one tab stop and arrow key navigation, so pens can be shown and hidden from the keyboard.
Roles: "img""group"
Key
Action
Tab
Moves into the legend, landing on the pen that holds the tab stop, and out again. The legend is one stop however many pens there are.
Arrow Left/Right
Moves between the pens. Reversed when rightToLeft is set.
Home / End
Moves to the first / last pen.
Enter or Space
Shows or hides the focused pen, raising penVisibilityChange.
The component follows the theme on the page: the default theme, or the ISA-101 light and dark themes that ship with the package. It declares 5 CSS variables of its own, among them --smart-strip-chart-height, --smart-strip-plot-background, --smart-strip-grid-color, --smart-strip-cursor-color. The CSS page lists them; the themes guide covers the tokens every component shares.