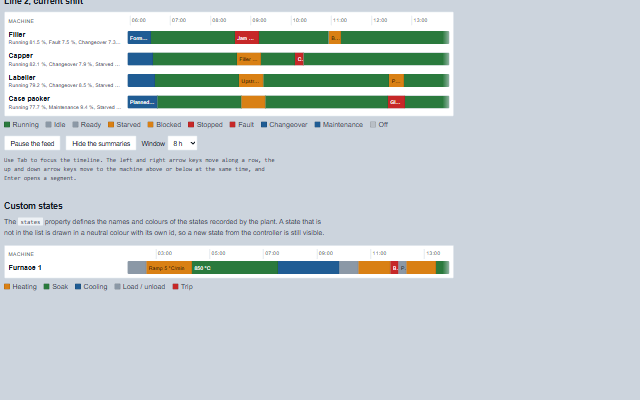
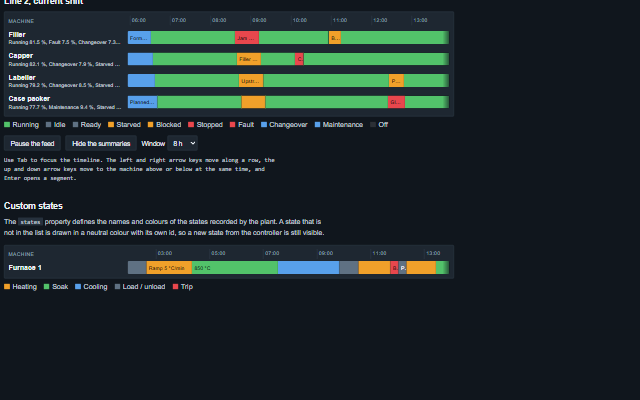
StateTimeline displays the state history of one or more machines as coloured segments on a time axis, one row per machine.
Each segment has a state, a start time, an end time and an optional reason; an open segment shows the current state. Segments are drawn and counted in time order with overlaps resolved (the later record wins), so the summaries never add up to more than the window. The component shows a legend, a time axis and, with showSummary, the time spent in each state, and provides the summary(), segmentAt() and push() methods for data feeds. The default state vocabulary covers running, idle, ready, starved, blocked, stopped, fault, changeover, maintenance and off, each with its own colour, and can be replaced. Segments narrower than two pixels are drawn together as one cell in the colour of the state that took most of it, with fine hairlines, named with every state under it and how long ("17 short states from 06:00 to 06:01: Running 35 s, Starved 13 s"): ten thousand segments are a few hundred elements, and the summaries still count every segment exactly. The arrow keys move along the time axis, which runs left to right on screen on a right-to-left page too, so ArrowRight is always later. Percentages and durations are written in the element's locale (12,5 % in German).
English, German, French, Spanish, Chinese, except the name of a cell that gathers short segments, which stays in English (locale packs)
In the demo: Line 2, current shift · Custom states. Open the demo
Quick start
Install the package, load the two stylesheets and the component's module, and put the element on the page. The element below is the first one of the demo. Put the script after the module, in a <script type="module">, so that it runs once the component is defined.
const stateTimeline = document.getElementById('line');

// raised when another segment is selected by a click or by receiving the keyboard focus
stateTimeline.addEventListener('selectionChange', (event) => {
    const { row, segment, state } = event.detail;
    // ...
});

// the same values as properties
stateTimeline.label = 'Line 2';
stateTimeline.showSummary = true;
The properties the demo sets, then the next ones; the API page lists all 11 with their types and defaults.
Name
Type, default
Description
rows
array
Sets or gets the rows, one per machine: { id, label, segments }, each segment { state, from, to, reason } with times in milliseconds since the epoch. A segment without to is open: it runs until the next segment in time, or to the end of the window. Segments may come in any order and are drawn and counted in time order; where two overlap, the one later in the array (the one pushed later) wins its interval and the earlier keeps what is left on either side, so no instant is counted twice and the time in each state never adds up to more than the window. A segment with no length is dropped. An item that is not usable - null, not an object, a segment with no state, a from that is not a time or a to before it - is skipped with one console warning per array. Assign a new array to update the component.
segments
array
Sets or gets the segments of a single machine, drawn as one row named by label, when there are no rows. The id of that row is 'row', whatever the label: pass 'row' to summary(), segmentAt() and push() to reach it. The segments are normalised as in rows.
states
array
Sets or gets the vocabulary: { id, label, color }, or just an id (a string or a number), where color is ok, warning, critical, accent, neutral, off or any CSS colour. A state the vocabulary does not name is drawn neutral with its id as its label. Empty is the floor's vocabulary: running, idle, ready, starved, blocked, stopped, fault, changeover, maintenance, off. Each of those has a look of its own, in the floor's vocabulary and in a vocabulary that names it without a colour: running a muted grey-green (the normal state is not a saturated green: colour is for what is wrong), idle a hatched light grey (not to be read as a gap), ready hollow, stopped a heavy slate, starved amber, blocked yellow with dark stripes, fault red, changeover blue, maintenance purple with light stripes, off a dashed outline. Each is a CSS variable (--smart-timeline-running, --smart-timeline-running-color and so on) a page can restyle. An item with no id is skipped with one console warning.
timeSpan
number 28800000
Sets or gets the width of the window in milliseconds, from 1000 (a second) to 315576000000 (ten years). A value that is not a positive number (NaN, Infinity, 0, negative) is ignored for the default 28800000 (8 h), and one outside the range is held at its end, each with one console warning. Over two months the axis is labelled with dates and years.
label
string
Sets or gets the name of the line or area, part of the accessible name and the name of the single row drawn from segments.
showSummary
boolean false
Sets or gets whether each row carries the time in each state over the window, as percentages, under its name.
end
number?
Sets or gets the right edge of the window in milliseconds since the epoch. Null follows the record: the latest end of a segment, or now while a segment is open. A value that is not a time (NaN, Infinity) is ignored with one console warning, and the axis follows the record.
selected
object?
Sets or gets the selected segment as { row, from }, or null.
showLegend
boolean true
Sets or gets whether the vocabulary is listed under the rows with its colours.
showTimeAxis
boolean true
Sets or gets whether the time axis is drawn above the rows.
The events carry their data in event.detail. The state timeline sets selected when the operator clicks or focuses a segment and then raises selectionChange. segmentClick reports a segment clicked or activated with Enter or Space.
Event
Description and detail
selectionChange
This event is triggered when another segment is selected by a click or by receiving the keyboard focus. Setting selected from script marks the segment and does not raise it.
rowstring The row's id. segmentobject The segment as it was given; for a cell of several short segments, the first of them. statestring The segment's state. fromnumber When the segment began, in milliseconds since the epoch. tonumber When it ended, or the end of the window for an open segment. countnumber How many segments the cell stands for: 1, or more for a cell of segments too short to draw one by one. segmentsarray Every segment under the cell, as given.
segmentClick
This event is triggered when a segment is clicked, or Enter or Space is pressed on it.
rowstring The row's id. segmentobject The segment as it was given; for a cell of several short segments, the first of them. statestring The segment's state. fromnumber When the segment began, in milliseconds since the epoch. tonumber When it ended, or the end of the window for an open segment. countnumber How many segments the cell stands for: 1, or more for a cell of segments too short to draw one by one. segmentsarray Every segment under the cell, as given.
Methods
Method
Description
summary(rowId) returns any[]
Returns the time in each state of a row over the window, longest first: [{ state, milliseconds, percent }]. It counts the record as drawn, overlaps resolved, so the milliseconds never add up to more than the window.
segmentAt(rowId, time) returns any
Returns the segment of a row under a time, as it was given, or null. Where segments overlap it is the one drawn there - the later one.
push(rowId, segment)
Appends a segment to the record of a row. An open segment of the row that started before the new one is closed at the new one's start. A segment that arrives late - starting before the open one - is slotted in where it happened and the open one stays ongoing; one that overlaps the record wins its interval. Intended for a data feed, with one call per state change. A row that does not exist is added. Something that is not a segment is refused with a console warning.
In Angular, React, Vue and Blazor
The same element with its wrapper. Each page has the installation steps and the full demo in that framework.
The StateTimeline conveys its information through the colour and the length of its segments, which are not available to a screen reader, so the timeline is exposed as a grid: one row per machine, and each segment a cell with a full accessible name such as "Fault from 11:00 to 12:00, 1 h 0 min, Jam at infeed", containing the state, the start and end times, the duration and the reason, or "since .. ongoing" for the open segment. The row header is the machine name and, with showSummary, the time in each state as percentages, so the availability figure is read rather than estimated from bar lengths. Colour is never the only indicator of a state: the segment name contains it, and a reason that fits is also printed.
Moves into the timeline, landing on the selected segment or the first, and out again. The timeline is one stop. Focus selects the segment and raises selectionChange.
Arrow Right / Arrow Left
Moves to the next / previous segment of the same machine.
Arrow Down / Arrow Up
Moves to the machine below / above, to its segment under the middle of the current one, what that machine was doing at the same minute, or the nearest.
Home / End
Moves to the first / last segment of the row.
Enter or Space
Raises segmentClick for the segment, the same event a click raises.
The component follows the theme on the page: the default theme, or the ISA-101 light and dark themes that ship with the package. It declares 31 CSS variables of its own, among them --smart-timeline-row-height, --smart-timeline-label-width, --smart-timeline-gap, --smart-timeline-ok. The CSS page lists them; the themes guide covers the tokens every component shares.