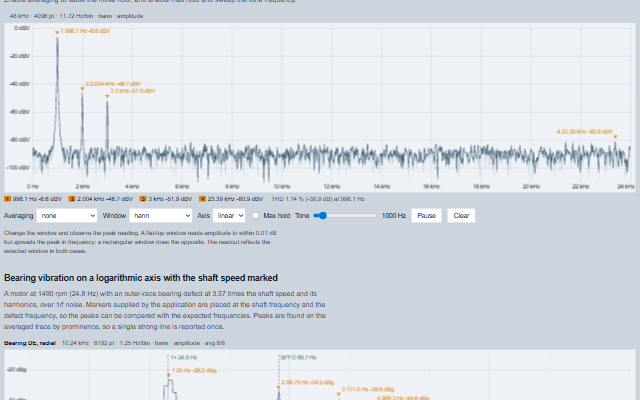
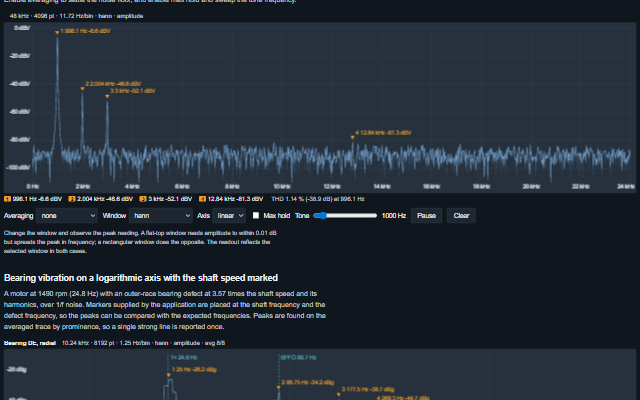
Sample blocks are pushed to the component and shown as their frequency content, with a linear or logarithmic frequency axis, levels in dB against a stated reference, linear or exponential averaging, max hold, peak markers, host-defined markers and a THD readout. The FFT and window functions are provided by Smart.DSP with the correct amplitude scaling for the selected window. The spectrum is drawn to a canvas and reduced to one envelope per pixel column.
Tag
<smart-spectrum>
Module
smart-industrial/source/modules/smart.spectrum.js
Angular
SpectrumModule from smart-industrial/angular/spectrum
English, German, French, Spanish, Chinese, except the name of the peaks list, which keeps the language the spectrum was created in (locale packs)
In the demo: A 1 kHz tone with distortion and noise at 48 kS/s · Bearing vibration on a logarithmic axis with the shaft speed marked. Open the demo
Quick start
Install the package, load the two stylesheets and the component's module, and put the element on the page. The element below is the first one of the demo. Put the script after the module, in a <script type="module">, so that it runs once the component is defined.
const spectrum = document.getElementById('audio');

// raised after each block is analysed, with the peaks found on the displayed trace
spectrum.addEventListener('spectrumChange', (event) => {
    const { peaks, binWidth, size } = event.detail;
    // ...
});

// the same values as properties
spectrum.sampleRate = 48000;
spectrum.showPeaks = 4;
spectrum.minProminence = 15;
spectrum.minLevel = -110;
The properties the demo sets, then the next ones; the API page lists all 28 with their types and defaults.
Name
Type, default
Description
sampleRate
number 1
Sets or retrieves the sample rate in samples per second. Every frequency on the display follows from it; the default of 1 reads frequencies in cycles per sample. A value that is not a positive number (0, negative, NaN) analyses nothing rather than computing a spectrum on a made-up rate: the header and the plot say "Sample rate 0 is not valid", the accessible name says the same, and one console warning names the value.
window
string hann
Sets or retrieves the window function applied before the transform. A flat-top window reads amplitude to within 0.01 dB but spreads the peak in frequency; a rectangular window does the opposite. The amplitude is corrected for the coherent gain of the window in every case.
frequencyScale
string linear
Sets or retrieves the frequency axis. A log axis starts at the first bin above DC, since it has no zero, and carries decade ticks with 2 and 5 minors.
minLevel
number
Sets or retrieves the bottom of the level axis. null follows the data with some headroom; a fixed value keeps the trace from rescaling as the signal changes, as on an analyzer. Set above maxLevel, the two are swapped; equal limits, or one limit that leaves no room against the data, let the axis follow the data. Each is said once in a console warning.
maxLevel
number
Sets or retrieves the top of the level axis. null follows the data with headroom. See minLevel for limits set the wrong way round.
averaging
string none
Sets or retrieves the spectrum averaging mode. none draws each block as it arrives. linear averages the first averages blocks and then holds the result until clear restarts the average, like a bench analyzer. exponential weights each new block by 1/averages and continues indefinitely. Averaging is performed in the power domain regardless of the display scaling, because averaging amplitudes or decibels biases the noise floor.
averages
number 8
Sets or retrieves how many blocks the average spans. Held to 1 to 10,000; not a number uses 8. Either is said once in a console warning.
peakHold
boolean false
Determines whether the highest level ever seen in each bin is kept as a second trace, until clear.
showPeaks
number 3
Sets or retrieves how many peaks are marked on the trace and listed in the readout, strongest first. 0 marks none. Peaks are found on the displayed trace, after averaging, by prominence, not height. Held to 0 to 100.
minProminence
number 6
Sets or retrieves how far a peak must stand above its surroundings to be marked, in the level scale's own unit, decibels, or linear magnitude. It keeps one strong tone's sidelobes from being reported as three peaks. Not below 0; not a number uses 6.
showThd
boolean false
Determines whether total harmonic distortion is measured against the strongest peak and shown in the readout, as a percentage and in dB. Requires amplitude scaling.
markers
array
Sets or retrieves markers placed by the application as [{ frequency, label }], drawn as labelled vertical lines, for example at the line frequency, a shaft speed, a bearing defect frequency or a filter corner, so the peaks can be compared with the expected frequencies.
paused
boolean false
Determines whether pushed blocks are dropped. The display holds its last spectrum.
label
string
Sets or retrieves the name of the channel, shown in the header and in the accessible name.
unit
string
Sets or retrieves the unit of the signal, for example V, g or Pa, so that a level is shown as dBV rather than dB and a linear level carries its unit.
The events carry their data in event.detail. spectrumChange reports a new analysis after the application pushes a block or sets signal. Blocks pushed while paused is true are dropped and raise nothing.
Event
Description and detail
spectrumChange
This event is triggered after each block is analysed, with the peaks found on the displayed trace.
peaksany[] The marked peaks, strongest first, as [{ frequency, level, magnitude, index, prominence }]. binWidthnumber The frequency resolution in hertz. sizenumber The transform size. invalidSamplesnumber How many samples of the block were not numbers and were analysed as zeros; 0 for a clean block.
Methods
Method
Description
push(samples) returns boolean
Analyses the next block of samples and redraws. The block is copied, so a DAQ can pass the same buffer each time. Averaging and max hold accumulate across pushes. Samples that are not numbers (NaN, null, an infinite value) are analysed as zeros, which lowers the levels by an amount that depends on how many there were, so the block is never passed off as clean: the header shows "2 of 4096 samples were not numbers (analysed as 0)", the accessible name and spectrumChange carry the count, and the console says so once per run of such blocks. A block with no number in it is not analysed. Returns false when the analyzer is paused and the block was dropped.
clear()
Clears the running average and the held maximum and restarts them from the block on screen.
spectrum() returns object
Returns the spectrum as currently shown, as { frequencies, magnitudes, levels, hold, binWidth, size, window, invalidSamples }, where levels are in the level scale, magnitudes are the linear values after averaging, hold is the max-hold trace or null, and invalidSamples is how many samples of the block were not numbers. Returns null before the first signal, and while the sample rate is not a positive number.
peaks() returns array
Returns the marked peaks, strongest first, as [{ frequency, level, magnitude, index, prominence }].
invalidate()
Redraws the plot on the next animation frame, so that many pushes between two frames cost one draw.
In Angular, React, Vue and Blazor
The same element with its wrapper. Each page has the installation steps and the full demo in that framework.
The Spectrum is drawn on a canvas, which is not accessible to a screen reader. Everything drawn on the canvas is therefore also available as text: the header contains the sample rate, the transform size, the bin width, the window and the averaging state, and the readout lists every marked peak with its frequency and level, and the THD value. The markers on the canvas show the same information graphically.
The component follows the theme on the page: the default theme, or the ISA-101 light and dark themes that ship with the package. It declares 3 CSS variables of its own, among them --smart-spectrum-height, --smart-spectrum-plot-background, --smart-spectrum-grid-color. The CSS page lists them; the themes guide covers the tokens every component shares.