Cause and Effect Matrix <smart-cause-effect-matrix>
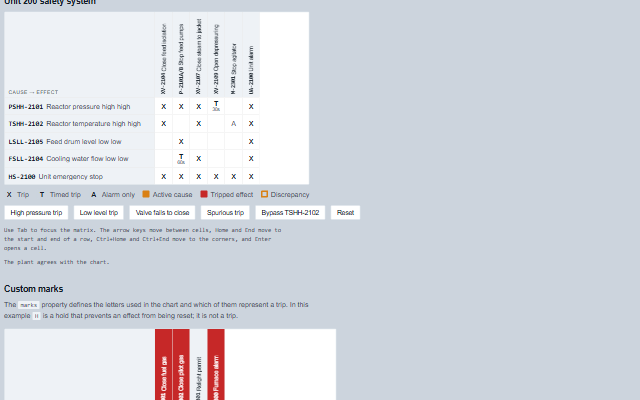
CauseEffectMatrix displays the cause and effect chart of a safety instrumented system as a live matrix.
Causes are rows, effects are columns, and each cell shows the mark that links them: X for a trip, T for a timed trip, P for a permissive and A for an alarm only. Active causes and tripped effects are highlighted, bypassed causes are marked, and the component reports a discrepancy when an effect is tripped without an active cause or expected to trip but is not. The causes, effects, links and states are supplied by the application from the safety controller; the component does not apply any logic or bypass itself.
English, German, French, Spanish, Chinese (locale packs)
In the demo: Unit 200 safety system · Custom marks. Open the demo
Quick start
Install the package, load the two stylesheets and the component's module, and put the element on the page. The element below is the first one of the demo. Put the script after the module, in a <script type="module">, so that it runs once the component is defined.
The properties the demo sets, then the next ones; the API page lists all 8 with their types and defaults.
Name
Type, default
Description
causes
array
Sets or gets the rows: { id, tag, label, active, bypassed, activeSince }. An active cause tints its row; a bypassed one is marked and does not count towards an expected trip. active and bypassed written as the text "false", "0", "no" or "off" are false. activeSince (a Date, epoch milliseconds or ISO text) is when the cause became active, used for timed trips; without it the component counts from when it first saw the cause active. Entries that are not objects are ignored. Assign a new array to update the component; the keyboard stays on the same cell across an update.
effects
array
Sets or gets the columns: { id, tag, label, tripped }. A tripped effect tints its column. tripped written as the text "false", "0", "no" or "off" is false.
matrix
array
Sets or gets the links: { cause, effect, mark, delay, note }. mark is X, T, P, A or any short text the marks property explains; delay is the seconds of a timed trip: a tripping link with a delay is expected only once its cause has been active that long, and until then the effect is shown as 'timed trip due in N s' (a dashed outline), not as a discrepancy; the component redraws itself when the trip falls due. note is read with the cell.
marks
object?
Sets or gets the meaning of the marks: { X: { label, trips } }, where trips says whether the mark means the effect is expected when the cause is active. Null is the standard set: X trip, T timed trip, P permissive, A alarm only. An object replaces the standard set; a mark it does not list, or an entry without trips: false, counts as a trip.
label
string
Sets or gets the name of the system, part of the accessible name.
selected
object?
Sets or gets the selected cell as { cause, effect }, or null.
showLegend
boolean true
Sets or gets whether the marks in use and the three states are explained under the chart.
highlightActive
boolean true
Sets or gets whether the rows of active causes and the columns of tripped effects are tinted.
Events
The events carry their data in event.detail. The cause and effect matrix sets selected when the operator clicks or focuses a cell and then raises selectionChange. cellClick, causeClick and effectClick report what was clicked and change nothing.
Event
Description and detail
selectionChange
This event is triggered when a different cell is selected by a click or by keyboard focus. Setting the selected property does not raise it.
causestring The cause's id. effectstring The effect's id. markstring The link's mark, or null where there is no link. linkobject The link as it was given, or null.
cellClick
This event is triggered when a cell is clicked, or Enter or Space is pressed on it.
causestring The cause's id. effectstring The effect's id. markstring The link's mark, or null where there is no link. linkobject The link as it was given, or null.
causeClick
This event is triggered when a cause's header is clicked.
causestring The cause's id. linksany[] Its links, each with its effect id.
effectClick
This event is triggered when an effect's header is clicked.
effectstring The effect's id. causesany[] The links to it, each with its cause id. expectedboolean Whether the chart expects it to be tripped now.
Methods
Method
Description
linksFor(causeId) returns any[]
Returns the links of a cause, as given, each with its effect id.
causesOf(effectId) returns any[]
Returns the links to an effect, as given, each with its cause id.
expected(effectId) returns boolean
Returns whether an effect is expected to be tripped now: an active, unbypassed cause links to it with a mark that trips, and, for a link with a delay, the cause has been active for at least that delay.
discrepancies() returns any[]
Returns the effects whose state does not match the chart, as [{ effect, expected, tripped }]: expected to trip but not tripped, or tripped with no active cause. An effect whose timed trip is still counting down is not a discrepancy.
In Angular, React, Vue and Blazor
The same element with its wrapper. Each page has the installation steps and the full demo in that framework.
The CauseEffectMatrix is exposed as a WAI-ARIA grid: the causes are row headers, the effects are column headers, and every intersection is a cell, whether or not it carries a mark. Each cell has a full accessible name, for example "PSHH-2101 to PSV-2101: Timed trip, 30 s delay, after the block valve", or "no link", so a mark that is a single letter on the chart is read as a word. A cause header includes "active" and "bypassed" after its name, and an effect header includes "tripped" and, when the plant state differs from the chart, "expected to trip but not tripped" or "tripped with no active cause". A new discrepancy is announced once, assertively, through the shared live region. The row and column colours carry the same states for sighted users and are never the only indicator.
Moves into the chart, landing on the cell that last had focus or the first cell, and out again. The chart is one stop. Focus selects the cell and raises selectionChange.
Arrow keys
Move between cells: left and right along a cause, up and down between causes under the same effect. Right Arrow on the last cell of a row moves to the first cell of the next row, and Left Arrow on the first cell moves to the last cell of the row above.
Home / End
Move to the first / last cell of the row; with Ctrl, to the first / last cell of the chart.
Page Up / Page Down
Move ten cells back or forward.
Enter or Space
Raises cellClick for the cell, the same event a click raises.
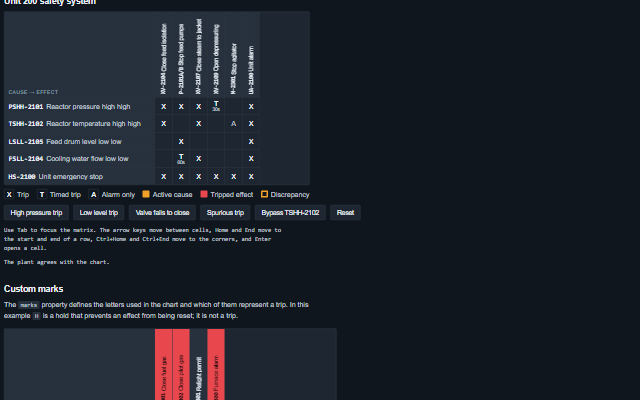
The component follows the theme on the page: the default theme, or the ISA-101 light and dark themes that ship with the package. It declares 13 CSS variables of its own, among them --smart-cem-cell-size, --smart-cem-cause-width, --smart-cem-cause-max, --smart-cem-effect-height. The CSS page lists them; the themes guide covers the tokens every component shares.