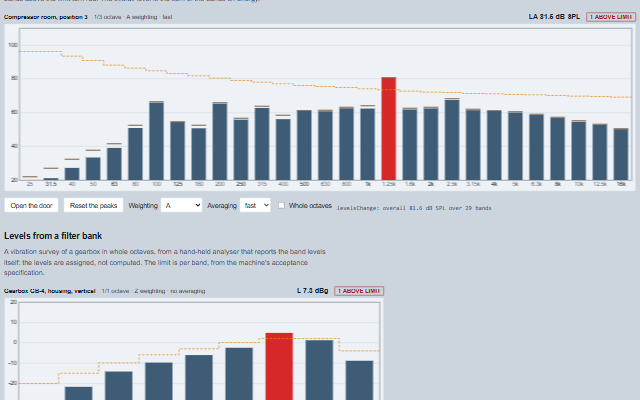
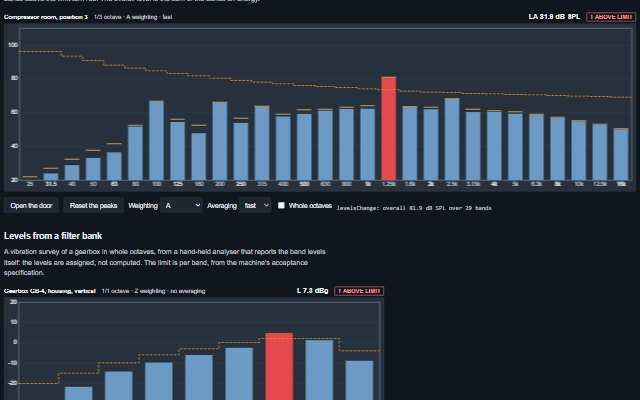
OctaveBands displays the level in each octave or third-octave band as a bar, with the frequency-weighted overall level and a limit curve the bands are checked against: the display of a sound level meter and of a vibration survey.
Bands follow IEC 61260 and the A and C weightings follow IEC 61672. Blocks of samples pushed to the component are analysed with the FFT of Smart.DSP, the power of the bins inside each band summed; an application with a real filter bank assigns the levels directly. Fast or slow averaging settles the bars, and peak hold keeps the highest level of each band. The class carries two static methods usable without an element: weighting(weighting, frequency), the A, C or Z weighting in dB at a frequency per IEC 61672, and nominal(centre), the nominal frequency a band is named by.
English, German, French, Spanish, Chinese (locale packs)
In the demo: A compressor room, in dB SPL · Levels from a filter bank. Open the demo
Quick start
Install the package, load the two stylesheets and the component's module, and put the element on the page. The element below is the first one of the demo. Put the script after the module, in a <script type="module">, so that it runs once the component is defined.
The properties the demo sets, then the next ones; the API page lists all 19 with their types and defaults.
Name
Type, default
Description
resolution
string third
Sets or retrieves the band width: whole octaves or third octaves.
sampleRate
number 48000
Sets or retrieves the sample rate of pushed blocks, in samples per second. A band is shown only when all of it lies below half the sample rate. A value that is not a positive number analyses nothing: push() returns false, the header says so, and one console warning names the value; assigned levels are still shown.
frequencyMin
number 20
Sets or retrieves the centre frequency of the lowest band shown. Set above frequencyMax, the two are swapped, with one console warning, rather than leaving the chart empty.
frequencyMax
number 20000
Sets or retrieves the centre frequency of the highest band shown. Bands whose upper edge lies above half the sample rate are not shown whatever this says: at a sample rate of 8 kHz the 4 kHz third-octave band, which runs to 4.49 kHz, would be summed from the bins that exist and read low.
weighting
string Z
Sets or retrieves the frequency weighting applied to each band and to the overall level: Z (none), A or C, per IEC 61672.
reference
number 1
Sets or retrieves what reads as 0 dB: 1 for dB re one unit of the signal, 0.00002 for dB SPL of a signal in pascal.
unit
string
Sets or retrieves the signal's unit, so a level reads dBV or, with the 20 µPa reference, dB SPL.
averaging
string fast
Sets or retrieves the exponential time weighting of the bars: none, fast (125 ms) or slow (1 s), as a meter's.
peakHold
boolean true
Keeps the highest level of each band as a marker.
levels
array
Sets or retrieves the level of each band in dB, in the order of bands(). Assigned by an application with its own filter bank, or computed by push.
limit
array
Sets or retrieves the limit the bands are checked against: a level per band in dB, or [{ frequency, level }] points interpolated across the bands on the log axis. A band above its limit is drawn in the exceeded colour and counted in the header. A null or non-numeric per-band value is no limit for that band; a point that is not an object with a frequency and a level is skipped. Either is said once in a console warning.
levelMin
number?
Sets or retrieves the bottom of the level axis in dB. Null follows the data. With levelMax set below it, the two are swapped; set equal, the axis follows the data. Either is said once in a console warning.
levelMax
number?
Sets or retrieves the top of the level axis in dB. Null follows the data. Fixes the axis together with levelMin.
label
string
Sets or retrieves the title shown in the header and used in the accessible name.
The events carry their data in event.detail. levelsChange reports levels the component has already computed from a pushed block and written to levels; blocks pushed while paused is true are dropped and raise nothing. bandClick reports a click on a band and changes nothing.
Event
Description and detail
levelsChange
This event is triggered after a pushed block has been analysed.
levelsarray The level of each band, in dB. overallnumber The overall level, in dB. invalidSamplesnumber How many samples of the block were not numbers and were analysed as zeros; 0 for a clean block.
bandClick
This event is triggered when a band is clicked.
indexnumber The band. centrenumber Its centre frequency. labelstring Its nominal frequency. levelnumber Its level. peaknumber Its held peak.
Methods
Method
Description
push(block) returns boolean
Analyses a block of samples into band levels and shows them, with averaging and peak hold applied. Samples that are not numbers are analysed as zeros, and never passed off as clean: the header shows how many, levelsChange carries the count, and the console says so once per run of such blocks. Returns false, and analyses nothing, when the analyser is paused, when Smart.DSP is not loaded, when the block is not an array of at least two samples or has no number in it, or when the sample rate is not a positive number.
bands() returns array
Returns the bands shown: [{ centre, low, high, label, index }], centres on the IEC 61260 base-10 series, between frequencyMin and frequencyMax, and only bands whose upper edge lies below half the sample rate.
overall() returns number
Returns the overall level: the levels of the bands summed on energy, in dB, or NaN with no levels.
clear()
Clears the levels and the peaks.
resetPeaks()
Drops the held peaks.
describe() returns string
Returns a sentence describing what the analyser shows, as used in its accessible name: the bands, the overall level, the highest band and the number above the limit (exceededSummaryOne for one).
invalidate()
Redraws the plot on the next animation frame, so that many changes between two frames cost one draw.
In Angular, React, Vue and Blazor
The same element with its wrapper. Each page has the installation steps and the full demo in that framework.
The OctaveBands is drawn on a canvas, which is not accessible to a screen reader. Everything drawn on the canvas is therefore also available as text: the header carries the band width, the weighting and the averaging, the overall level is a status line that is announced when it changes, the number of bands above the limit is written out, and a list under the plot gives the level of every band with its centre frequency. The plot's label names the overall level and the highest band.
The component follows the theme on the page: the default theme, or the ISA-101 light and dark themes that ship with the package. It declares 4 CSS variables of its own, among them --smart-octave-height, --smart-octave-plot-background, --smart-octave-grid-color, --smart-octave-axis-color. The CSS page lists them; the themes guide covers the tokens every component shares.
From a front panel to the browserEvery control and indicator of a test-and-measurement front panel mapped to a component, the mechanical actions, and where the data comes from.
Engineering MathsDSP, statistical process control and series reduction functions, usable without the components.
PerformanceMeasured throughput of the strip chart, scope, trend, alarm grid, heatmap, terminal and audit trail, and how the figures are achieved.