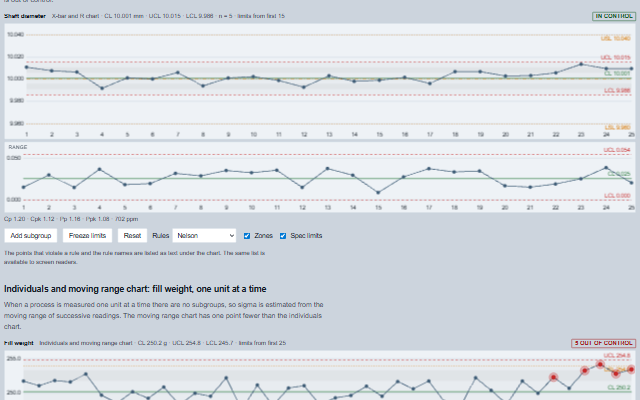
ControlChart is a Shewhart control chart for statistical process control.
It supports the X-bar/R, X-bar/S and I-MR variable charts and the p, np, c and u attribute charts, each with its range, standard deviation or moving range chart, and applies the Nelson or Western Electric run rules to every point. Points that violate a rule are marked on the chart, listed as text and raised as an event. Control limits are computed from a baseline or set directly, and specification limits are drawn separately and used for the Cp and Cpk readout. All statistics are computed by Smart.Industrial.spc.
English, German, French, Spanish, Chinese, except the name of the rule-violations list, which keeps the language the chart was created in (locale packs)
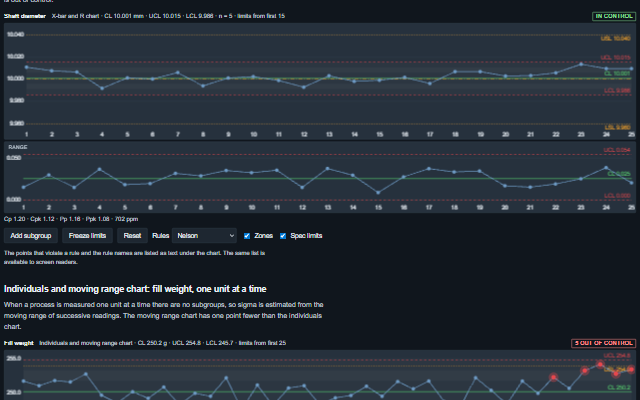
In the demo: X-bar and R chart: shaft diameter in subgroups of five · Individuals and moving range chart: fill weight, one unit at a time · p chart: fraction defective with unequal sample sizes. Open the demo
Quick start
Install the package, load the two stylesheets and the component's module, and put the element on the page. The element below is the first one of the demo. Put the script after the module, in a <script type="module">, so that it runs once the component is defined.
const controlChart = document.getElementById('xbar');

// raised when the set of offending points changes, after new data, new limits or a
// different rule set, and not on every redraw
controlChart.addEventListener('violation', (event) => {
    const { violations, count } = event.detail;
    // ...
});

// the same values as properties
controlChart.precisionDigits = 3;
controlChart.type = 'xbar-r';
controlChart.label = 'Shaft diameter';
controlChart.unit = 'mm';
The properties the demo sets, then the next ones; the API page lists all 17 with their types and defaults.
Name
Type, default
Description
type
string i-mr
Sets or retrieves which chart is drawn. The shape of data follows from it: an array of subgroups (arrays of readings) for xbar-r and xbar-s, an array of individual readings for i-mr, and an array of counts for the attribute charts, defectives per sample for p and np, defects per unit for c and u.
data
array
Sets or retrieves the measurements, in the format expected by type. Assign a new array to update the component; an array modified in place is deep-equal to the current one and does not trigger a redraw. A missing reading (null, an empty string) and, on an X-bar chart, a subgroup with fewer than two readings are left off the chart; the sample numbers on the axis and in the violation list stay those of data.
sampleSize
number | null
Sets or retrieves the sample size for the p, np and u charts, as one number or as an array with one entry per sample when the size varies. With unequal sample sizes the limits of a p chart differ from sample to sample and are drawn as steps.
baselineCount
number 0
Sets or retrieves the number of initial points used to establish the control limits. 0 uses every point. In practice, limits are established from a baseline phase and then held, because a chart that recomputes its limits on every new point cannot signal a shift.
limits
object
Sets or retrieves held limits for the primary chart as { center, ucl, lcl, sigma }, which replace the computed limits. Set by freezeLimits, or by an application that established limits in a qualification run and monitors against them. The secondary chart keeps its computed limits.
ruleSet
string | null nelson
Sets or retrieves the run rules to test: nelson (eight rules), westernElectric (four rules), both, none, or an array of rule names as listed by Smart.Industrial.spc.ruleNames. Rules are identified by name because the numbering differs between sources. On an attribute chart with unequal samples there is no single sigma, so only the limit test is applied, point by point against the limits of that point.
showZones
boolean true
Determines whether the one, two and three sigma zones on either side of the centre line are shaded, so that the zone of a point can be read from the chart.
specLimits
object
Sets or retrieves the specification limits as { lsl, usl, target }. They are drawn on the primary chart in their own line style, labelled USL and LSL, and used for the capability readout. They are not used for the control limits or the run rules: control limits describe what the process does, and specification limits describe what the customer requires.
label
string
Sets or retrieves the name of the characteristic being charted, shown in the header and in the accessible name.
unit
string
Sets or retrieves the engineering unit, shown beside the centre line value.
precisionDigits
number 2
Sets or retrieves how many decimal places the limits, ticks and annotations are printed with.
The events carry their data in event.detail. violation reports a change in the set of points that break the selected rules, computed from data. A redraw alone raises nothing.
Event
Description and detail
violation
This event is triggered when the set of offending points changes, after new data, new limits or a different rule set, and not on every redraw. It fires with a count of zero when the chart returns to control.
violationsany[] The offending points as [{ index, point, rules, chart }], where index is the position in data, point the position on the chart, and chart is 'secondary' for a point on the range, S or moving range chart. countnumber How many points are out of control.
Methods
Method
Description
chart() returns object
Returns the computed primary chart as { type, points, center, ucl, lcl, sigma, n, secondary, held }, as returned by Smart.Industrial.spc, with held limits applied. ucl and lcl are arrays when the sample size varies.
violations() returns array
Returns which points on the primary chart break which rules, as [{ index, point, rules }]: index is the position in data of the sample or subgroup that broke the rule, point its position on the chart. They differ when the chart leaves a missing reading or an incomplete subgroup out. A point that breaks nothing is not in the list.
secondaryViolations() returns array
Returns the points on the secondary chart, the range, standard deviation or moving range, that lie beyond its own limits, as [{ index, point, rules }]. index is the position in data; a moving range belongs to the later of its two readings.
capability() returns object
Returns the process capability against the specification limits as { n, mean, sigmaWithin, sigmaOverall, cp, cpk, pp, ppk, ppm }, or null without specification limits or for an attribute chart. Sigma within is the estimate the chart is built on: S-bar / c4 for xbar-s, R-bar / d2 for xbar-r and the average moving range / d2 for i-mr.
freezeLimits() returns object
Holds the limits currently shown by the chart, so that data arriving after this point is judged against them instead of changing them. Sets the limits property and returns it.
invalidate()
Redraws the plots on the next animation frame, so that many changes between two frames cost one draw.
In Angular, React, Vue and Blazor
The same element with its wrapper. Each page has the installation steps and the full demo in that framework.
The ControlChart is drawn on a canvas, which is not accessible to a screen reader. Everything drawn on the canvas is therefore also available as text: the header contains the chart type, the centre line, the limits and the in-control status; the violation list names every point that violates a rule and the rules it violates; and the capability readout contains Cp and Cpk. The marks on the canvas show the same information graphically.
The component follows the theme on the page: the default theme, or the ISA-101 light and dark themes that ship with the package. It declares 9 CSS variables of its own, among them --smart-control-chart-height, --smart-control-chart-secondary-share, --smart-control-chart-plot-background, --smart-control-chart-grid-color. The CSS page lists them; the themes guide covers the tokens every component shares.