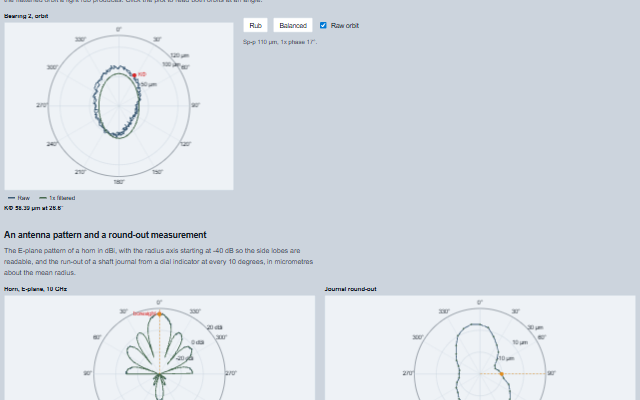
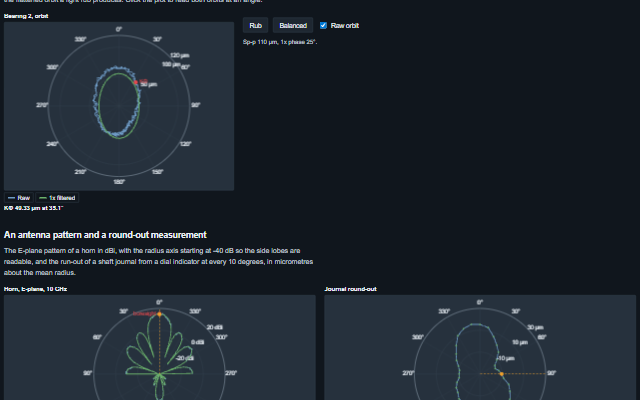
PolarPlot displays data on a circular grid: a radius against an angle, or an x and a y about a centre.
It is the orbit a pair of proximity probes draws of a shaft, the pattern an antenna radiates and the round-out a dial indicator records. Angles start to the right or at the top and run counterclockwise or clockwise. The radius axis can start below zero, so a pattern in dBi reads its floor at the centre. Markers name a point, and a cursor at an angle reads every plot's radius there.
English, German, French, Spanish, Chinese (locale packs)
In the demo: A shaft orbit from two proximity probes, live · An antenna pattern and a round-out measurement. Open the demo
Quick start
Install the package, load the two stylesheets and the component's module, and put the element on the page. The element below is the first one of the demo. Put the script after the module, in a <script type="module">, so that it runs once the component is defined.
const polarPlot = document.getElementById('orbit');

// raised when the cursor is placed or moved by the operator
polarPlot.addEventListener('cursorChange', (event) => {
    const { angle } = event.detail;
    // ...
});

// the same values as properties
polarPlot.label = 'Bearing 2, orbit';
polarPlot.radiusUnit = 'µm';
polarPlot.angleOrigin = 'top';
polarPlot.angleDirection = 'clockwise';
The properties the demo sets, then the next ones; the API page lists all 15 with their types and defaults.
Name
Type, default
Description
plots
array
Sets or retrieves the plots. Each is an object with id, label, color, lineWidth, visible, style (line or points), closed (joins the last point to the first) and either angles and radii or x and y about the centre. A point without a reading - null, NaN or an infinite value on either axis - is a gap in the trace: not drawn, not read by the cursor, not in the radius range, and counted in the readout and the accessible name ("no reading at 2 of 360 points"), with one console warning. An item that is not an object is skipped, with one console warning.
markers
array
Sets or retrieves the markers: named points, each an object with label, color and either angle and radius or x and y. They are drawn on the plot and listed under it. An item that is not an object is skipped, with one console warning.
angleOrigin
string right
Sets or retrieves where angle zero points.
angleDirection
string counterclockwise
Sets or retrieves the direction angles increase in.
radiusMax
number?
Sets or retrieves the radius at the rim. Null follows the data, rounded up to a nice number. A value that is not above the centre (radiusMin equal to radiusMax, for one) leaves no radius axis, so it is ignored and the rim follows the data; this, a value that is not a finite number, and limits set the wrong way round (swapped) are each said once in a console warning.
radiusUnit
string
Sets or retrieves the unit of the radius, used in the ring labels and the readouts.
cursor
number?
Sets or retrieves the angle of the cursor, which reads every plot. Null hides it. The cursor is placed by clicking the plot and moved with the arrow keys; the arrows rotate it on screen, the same in a right-to-left layout. Where a plot has nothing drawn at the cursor's angle - beyond the ends of an open trace, or across a gap - its reading is "--".
label
string
Sets or retrieves the title shown above the plot and used in the accessible name.
lineWidth
number 1.6
Sets or retrieves the line width of the plots, in pixels. A plot can carry its own.
angleUnit
string deg
Sets or retrieves the unit of angles given and shown.
The events carry their data in event.detail. The polar plot moves cursor as the operator drags or presses an arrow key, only while interactive is true, and then raises cursorChange. plotVisibilityChange follows a legend click or a togglePlot() call after the plot is already shown or hidden.
Event
Description and detail
cursorChange
This event is triggered when the cursor is placed or moved by the operator.
anglenumber The cursor angle, in the element's angle unit.
plotVisibilityChange
This event is triggered when a plot is hidden or shown from the legend.
idstring The plot. visibleboolean Whether it is now shown.
Methods
Method
Description
valueAt(id, angle) returns number
Returns a plot's radius at an angle, interpolated between the neighbouring points that span it - from the last point back to the first only when the plot is closed, as drawn. Returns NaN where the plot has nothing drawn at that angle: beyond the ends of an open trace, across a gap, or for an unknown plot.
togglePlot(id, visible?)
Shows or hides a plot.
describe() returns string
Returns a sentence describing what the plot shows, as used in its accessible name: the number of plots, the radius range, where the largest radius is, and how many points of a plot have no reading.
invalidate()
Redraws the plot on the next animation frame, so that many changes between two frames cost one draw.
In Angular, React, Vue and Blazor
The same element with its wrapper. Each page has the installation steps and the full demo in that framework.
The PolarPlot is drawn on a canvas, which is not accessible to a screen reader. What the canvas shows is therefore also available as text: the plot area carries a summary with the number of plots, the radius range and where the largest radius is; every marker is listed under the plot with its radius and angle; and the cursor readout lists the radius of every plot at the cursor angle. Moving the cursor with the keyboard updates the readout, so a value is taken from the plot by its angle.
The component follows the theme on the page: the default theme, or the ISA-101 light and dark themes that ship with the package. It declares 4 CSS variables of its own, among them --smart-polar-height, --smart-polar-plot-background, --smart-polar-grid-color, --smart-polar-axis-color. The CSS page lists them; the themes guide covers the tokens every component shares.
From a front panel to the browserEvery control and indicator of a test-and-measurement front panel mapped to a component, the mechanical actions, and where the data comes from.
Engineering MathsDSP, statistical process control and series reduction functions, usable without the components.
PerformanceMeasured throughput of the strip chart, scope, trend, alarm grid, heatmap, terminal and audit trail, and how the figures are achieved.