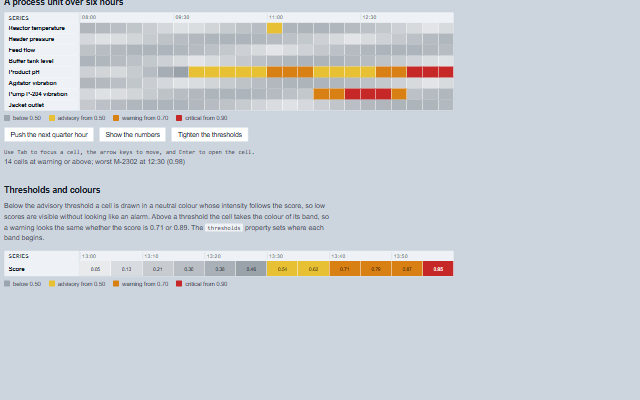
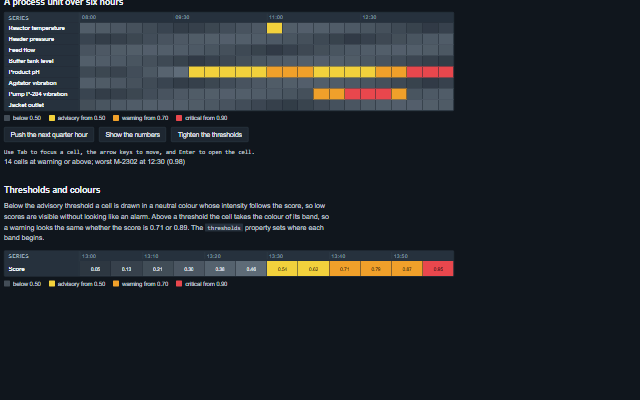
AnomalyHeatmap displays anomaly scores as a heatmap with one row per tag or asset and one column per time interval.
Each cell shows the highest score reported in the interval; cells below the first threshold use a neutral scale and cells above the advisory, warning and critical thresholds use the alarm colours. The component supports keyboard navigation and selection, and raises events when a cell is selected or activated so the application can open the related trend. In a narrow container the grid opens scrolled to the newest interval and stays there as data arrives, until the operator scrolls back; in right-to-left the grid is mirrored, newest on the left, and the arrow keys follow it. Times are written in the element's locale on the 24-hour clock.
English, German, French, Spanish, Chinese (locale packs)
In the demo: A process unit over six hours · Thresholds and colours. Open the demo
Quick start
Install the package, load the two stylesheets and the component's module, and put the element on the page. The element below is the first one of the demo. Put the script after the module, in a <script type="module">, so that it runs once the component is defined.
const anomalyHeatmap = document.getElementById('unit');

// raised when a cell is selected, by focus or by a click
anomalyHeatmap.addEventListener('selectionChange', (event) => {
    const { series, timestamp, score } = event.detail;
    // ...
});

// the same values as properties
anomalyHeatmap.timeSpan = 21600000;
anomalyHeatmap.bucket = 900000;
anomalyHeatmap.label = 'Unit 200';
The properties the demo sets, then the next ones; the API page lists all 13 with their types and defaults.
Name
Type, default
Description
series
array
Sets or retrieves the rows as [{ id, label }] or as plain ids. The id is the value a sample carries in its series field. Assign a new array to update the component.
data
array
Sets or retrieves the samples as [{ series, timestamp, score }], where score is between 0 and 1. A cell shows the highest score of the samples in its interval; a sample without a series or a score is dropped. Assigning the property replaces the samples; push adds to them.
timeSpan
number 86400000
Sets or retrieves the width of the time axis, in milliseconds. A day by default.
bucket
number 900000
Sets or retrieves one column's width in time, in milliseconds. Fifteen minutes by default. The column count is timeSpan divided by bucket.
thresholds
object {"advisory":0.5,"warning":0.7,"critic…
Sets or retrieves the start of each band as { advisory, warning, critical }. A score below the advisory threshold is drawn in a neutral colour whose intensity follows the score; from each threshold up, a cell takes the alarm colour of its band.
showValues
boolean false
Determines whether each cell prints its score. Off by default: at the default cell size the number does not fit, and the colour and the label carry it.
label
string
Sets or retrieves a name for the heatmap, spoken as part of the grid's label.
end
number?
Sets or retrieves the right edge of the time axis as a timestamp; the columns cover the time span up to it. null follows the data: the axis ends at the end of the interval that contains the newest sample, or at the current time when there are no samples, aligned to an interval boundary.
maxClockSkew
number? 300000
Sets or retrieves how far ahead of this computer's clock, in milliseconds, a pushed sample may be stamped. A sample stamped later than that and more than one interval after the newest sample held is ignored: push returns false and a warning is written to the console once per series. Without it, one sample from a device whose clock is a year out - or seconds read as milliseconds - moved the axis to that time and dropped every real sample off it. A feed that runs ahead of the clock one interval at a time, such as a simulation or a replay, is still followed. null takes every timestamp as given. Samples assigned through data are taken as given.
selected
object?
Sets or retrieves the selected cell, as { series, timestamp }, or null. Focusing or clicking a cell selects it.
The events carry their data in event.detail. The anomaly heatmap sets selected when the operator clicks or focuses a cell and then raises selectionChange. cellClick reports a cell activated by a click, Enter or Space.
Event
Description and detail
selectionChange
This event is triggered when a cell is selected, by focus or by a click.
seriesstring The series id. timestampnumber The start of the cell's interval. scorenumber The cell's score, or NaN when it has none. severitystring The cell's band: normal, advisory, warning or critical.
cellClick
This event is triggered when a cell is activated, clicked, or Enter or Space pressed on it. A host opens the trend behind the cell here, or asks the operator whether the model was right.
seriesstring The series id. timestampnumber The start of the cell's interval. scorenumber The cell's score, or NaN when it has none. severitystring The cell's band: normal, advisory, warning or critical.
Methods
Method
Description
push(sample) returns boolean
Adds one sample and redraws the cell it lands in; the grid is rebuilt only when the axis moves on to a new interval, so a unit of fifty series over a day takes a sample in a few milliseconds. A sample without a timestamp is stamped with the current time. Returns false when the sample has no series or no score, or is stamped too far ahead of the clock (see maxClockSkew).
scoreAt(series, time) returns number
Returns the worst score in the bucket that holds a time, for a series, or NaN when nothing landed there.
severityOf(score) returns string
Returns the band a score falls in: advisory, warning, critical, or normal below the first threshold.
hotspots(severity?) returns any[]
Returns the cells at or above a severity, highest score first, as [{ series, timestamp, score, severity }].
In Angular, React, Vue and Blazor
The same element with its wrapper. Each page has the installation steps and the full demo in that framework.
The AnomalyHeatmap is a grid of coloured cells. Because colour is not available to a screen reader, every cell states in text what its colour means: the series, the interval, the score to the component's precision and the band, for example "Reactor temperature, 10:15, score 0.83, warning". The grid is exposed as a WAI-ARIA grid with rows, row headers, column headers and cells, and has one tab stop regardless of the number of cells. Below the first threshold the cells differ only in the intensity of a neutral colour, so the score is spoken even where it is not printed.
The component follows the theme on the page: the default theme, or the ISA-101 light and dark themes that ship with the package. It declares 5 CSS variables of its own, among them --smart-heatmap-cell-size, --smart-heatmap-row-height, --smart-heatmap-series-width, --smart-heatmap-gap. The CSS page lists them; the themes guide covers the tokens every component shares.