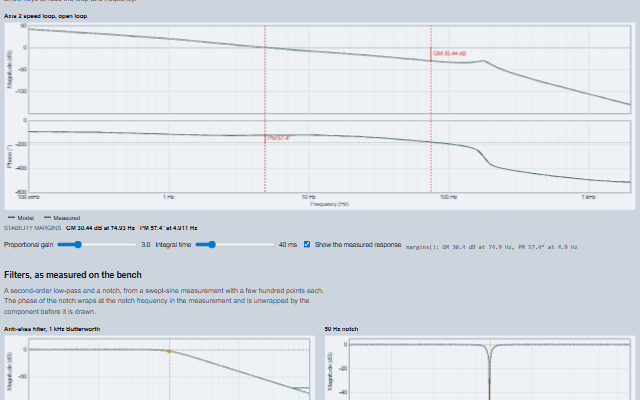
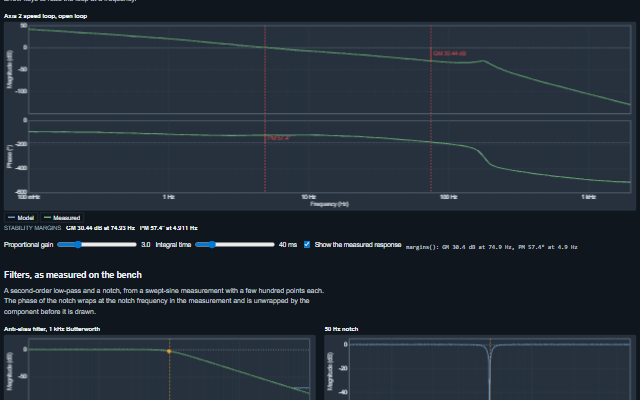
BodePlot displays magnitude and phase against a logarithmic frequency axis, one band above the other.
A response is given as measured points or as a transfer function in s that the component evaluates across the frequency range, so a model and a measurement sit on the same axes. The gain and phase margins are read off an open-loop response, marked on both bands and written out. A transfer function's phase is followed continuously from its low-frequency asymptote (-90° for each integrator), so a double integrator with a lag reads from about -180° downwards; measured phase is unwrapped along the frequency axis from its first point, and points may be given in either frequency order. A cursor reads every response at one frequency.
Tag
<smart-bode-plot>
Module
smart-industrial/source/modules/smart.bodeplot.js
Angular
BodePlotModule from smart-industrial/angular/bodeplot
English, German, French, Spanish, Chinese (locale packs)
In the demo: A servo speed loop: the open-loop response and its margins · Filters, as measured on the bench. Open the demo
Quick start
Install the package, load the two stylesheets and the component's module, and put the element on the page. The element below is the first one of the demo. Put the script after the module, in a <script type="module">, so that it runs once the component is defined.
const bodePlot = document.getElementById('loop');

// raised when the cursor is placed or moved by the operator
bodePlot.addEventListener('cursorChange', (event) => {
    const { frequency } = event.detail;
    // ...
});

// the same values as properties
bodePlot.label = 'Axis 2 speed loop, open loop';
bodePlot.showMargins = true;
The properties the demo sets, then the next ones; the API page lists all 18 with their types and defaults.
Name
Type, default
Description
plots
array
Sets or retrieves the responses. Each is an object with id, label, color, lineWidth, visible and either frequencies, magnitude and phase (measured points, magnitude in dB or linear per magnitudeUnit, phase in degrees) or transferFunction ({ numerator, denominator } as polynomial coefficients in s, highest power first).
frequencyMin
number?
Sets or retrieves the start of the frequency axis. With frequencyMax, fixes the axis and the range a transfer function is evaluated over; null follows the measured points.
frequencyMax
number?
Sets or retrieves the end of the frequency axis.
showMargins
boolean false
Marks the gain and phase margins of the first visible response on both bands and writes them out under the plot. A margin at or below zero is marked as failing. The phase margin is measured to the nearest -180° + k·360° line, so it lies between -180° and 180° and is negative for an unstable loop. With several crossings the smallest phase margin and the gain margin closest to 0 dB are shown; margins() lists every crossing.
label
string
Sets or retrieves the title shown above the plot and used in the accessible name.
frequencyUnit
string Hz
Sets or retrieves the unit of the frequency axis. A transfer function is evaluated at s = jω with ω in rad/s either way.
magnitudeUnit
string dB
Sets or retrieves how measured magnitude is given. Linear values are converted to dB; the plot always shows dB.
magnitudeMin
number?
Sets or retrieves the bottom of the magnitude band in dB. Null follows the data.
magnitudeMax
number?
Sets or retrieves the top of the magnitude band in dB. Null follows the data.
phaseMin
number?
Sets or retrieves the bottom of the phase band in degrees. Null follows the data.
The events carry their data in event.detail. The Bode plot moves cursor as the operator drags or presses an arrow key, only while interactive is true, and then raises cursorChange. plotVisibilityChange follows a legend click or a togglePlot() call after the response is already shown or hidden.
Event
Description and detail
cursorChange
This event is triggered when the cursor is placed or moved by the operator.
frequencynumber The cursor frequency.
plotVisibilityChange
This event is triggered when a response is hidden or shown from the legend.
idstring The response. visibleboolean Whether it is now shown.
Methods
Method
Description
valueAt(id, frequency) returns object
Returns a response at a frequency as { magnitude, phase } in dB and degrees, interpolated on the log axis, or NaN outside the record.
margins(id?) returns object
Returns the stability margins of a response as { gainMargin, gainMarginFrequency, phaseMargin, phaseMarginFrequency, gainMargins, phaseMargins }, NaN where there is no crossing. The phase margin at a gain crossover is measured to the nearest -180° + k·360° line (between -180° and 180°, negative when the loop is unstable there); the gain margin is read at every frequency where the phase crosses -180° + k·360°. With several crossings, phaseMargin is the smallest phase margin and gainMargin the one closest to 0 dB; gainMargins and phaseMargins list every crossing as { margin, frequency } in ascending frequency.
Evaluates a transfer function at a frequency and returns { magnitude, phase } in dB and degrees. The phase is the continuous phase of the response, anchored at its low-frequency asymptote (-90° for each integrator, +90° for each differentiator, -180° more for a negative gain), not an angle folded into -180°..180°.
togglePlot(id, visible?)
Shows or hides a response.
describe() returns string
Returns a sentence describing what the plot shows, as used in its accessible name, with the margins when they are shown.
In Angular, React, Vue and Blazor
The same element with its wrapper. Each page has the installation steps and the full demo in that framework.
The BodePlot is drawn on a canvas, which is not accessible to a screen reader. What the canvas shows is therefore also available as text: the plot area carries a summary with the number of responses, the frequency range and, when they are shown, the gain and phase margins with their frequencies; the margins are also a status line under the plot, so a change of margin is announced; and the cursor readout lists the magnitude and phase of every response at the cursor frequency.
The component follows the theme on the page: the default theme, or the ISA-101 light and dark themes that ship with the package. It declares 4 CSS variables of its own, among them --smart-bode-height, --smart-bode-plot-background, --smart-bode-grid-color, --smart-bode-axis-color. The CSS page lists them; the themes guide covers the tokens every component shares.
From a front panel to the browserEvery control and indicator of a test-and-measurement front panel mapped to a component, the mechanical actions, and where the data comes from.
Engineering MathsDSP, statistical process control and series reduction functions, usable without the components.
PerformanceMeasured throughput of the strip chart, scope, trend, alarm grid, heatmap, terminal and audit trail, and how the figures are achieved.