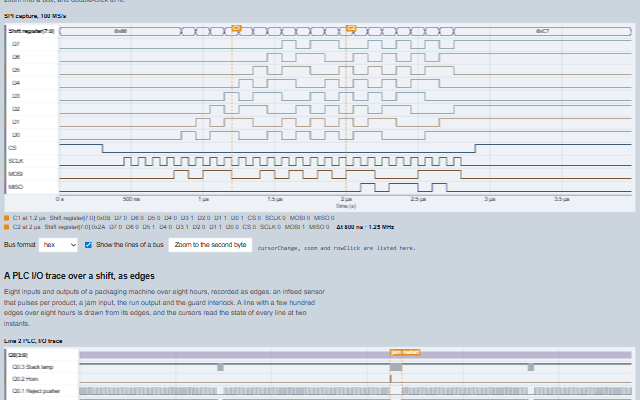
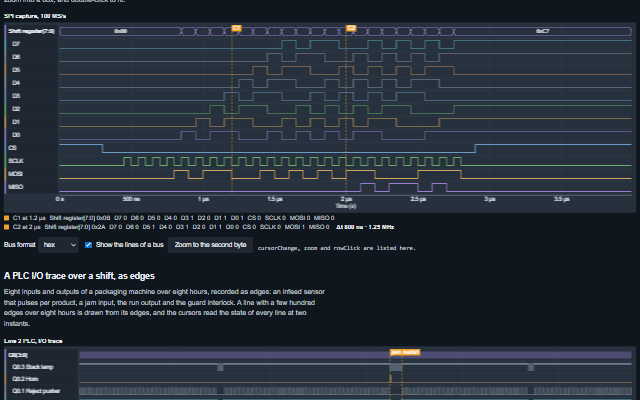
DigitalWaveform displays digital lines against time, one row per line, with lines grouped into buses whose words are written in hex, binary or decimal: the view of a logic analyser.
A line is given as samples on a fixed interval or as a list of edges. The view pans and zooms, cursors read every line and every bus at two instants and the time between them, and where more transitions land on a pixel column than it can show, the column is drawn as a block. The plot is as tall as its rows.
English, German, French, Spanish, Chinese (locale packs)
In the demo: An SPI transaction, 8 bit words at 10 MHz · A PLC I/O trace over a shift, as edges. Open the demo
Quick start
Install the package, load the two stylesheets and the component's module, and put the element on the page. The element below is the first one of the demo. Put the script after the module, in a <script type="module">, so that it runs once the component is defined.
const digitalWaveform = document.getElementById('spi');

// raised when a cursor is moved by the operator, with the pointer or the keyboard
digitalWaveform.addEventListener('cursorChange', (event) => {
    const { id, x } = event.detail;
    // ...
});

// the same values as properties
digitalWaveform.label = 'SPI capture, 100 MS/s';
digitalWaveform.xLabel = 'Time';
The properties the demo sets, then the next ones; the API page lists all 15 with their types and defaults.
Name
Type, default
Description
signals
array
Sets or retrieves the lines. Each is an object with id, label, color, visible and either samples (0/1 or booleans on a fixed interval, with t0 and dt) or edges (an array of [time, level] pairs, with end for the end of the record). A sample holds its level for dt, so a sampled record runs from t0 to t0 + samples.length × dt and the last sample is drawn and read. A level may also be 'x' (unknown, drawn as a band across both levels) or 'z' (high impedance, drawn between them).
buses
array
Sets or retrieves the buses. Each is an object with id, label, lines (the ids of its signals, most significant first), format (hex, bin or dec), color and visible. A bus is drawn as a row of stable words with a transition wherever the word changes. Any number of lines is exact: a bus of more than 53 lines is read as a BigInt. The word reads X while any line is unknown and Z while any line is high impedance.
xLabel
string
Sets or retrieves the name of the time axis.
cursors
array
Sets or retrieves the cursors. Each is an object with id, label, x, color and visible. The cursor legend reads every line and bus at each cursor and the time between the first two.
showLines
boolean true
Shows the lines of a bus under its row. When false, a bus is one row and its lines are left out.
label
string
Sets or retrieves the title shown above the plot and used in the accessible name.
xUnit
string s
Sets or retrieves the unit of the time axis, written in engineering notation.
xMin
number?
Sets or retrieves the start of the time axis. With xMax, fixes the axis; null follows the data.
xMax
number?
Sets or retrieves the end of the time axis. With xMin, fixes the axis; null follows the data.
rowHeight
number 26
Sets or retrieves the height of a row in pixels. The plot is as tall as its rows.
The events carry their data in event.detail. While interactive is true, the digital waveform moves a cursor in cursors and then raises cursorChange, and pans or zooms its own view and then raises zoom; fit() and zoomTo() also raise zoom. rowClick reports the row and the time under a click.
Event
Description and detail
cursorChange
This event is triggered when a cursor is moved by the operator, with the pointer or the keyboard.
idstring The cursor. xnumber Its time.
zoom
This event is triggered when the view changes: a zoom, a pan, a box zoom or a fit.
xMinnumber The start of the view. xMaxnumber The end of the view. fittedboolean True when the view shows the whole record.
rowClick
This event is triggered when a row is clicked without dragging.
timenumber The time under the pointer. idstring The line or bus clicked, or null below the rows. kindstring line or bus.
Methods
Method
Description
valueAt(id, time) returns any
Returns a line's level at a time: 1, 0, 'x' (unknown), 'z' (high impedance), or NaN outside the record.
busValueAt(id, time) returns any
Returns a bus's word at a time, most significant line first: a number, or a BigInt for a bus of more than 53 lines, which a number cannot hold exactly; 'x' when any line is unknown, 'z' when any line is high impedance, or NaN where any line is outside its record.
fit()
Shows the whole record again.
zoomTo(from, to)
Shows a range of time.
zoom(factor)
Zooms about the centre of the view.
describe() returns string
Returns a sentence describing what the graph shows, as used in its accessible name.
In Angular, React, Vue and Blazor
The same element with its wrapper. Each page has the installation steps and the full demo in that framework.
The DigitalWaveform is drawn on a canvas, which is not accessible to a screen reader. What the canvas shows is therefore also available as text: the plot area carries a summary with the number of lines and buses and the time range shown, and the cursor legend reads the level of every line and the word of every bus at each cursor, and the time between the first two cursors. Moving a cursor with the keyboard updates the legend, so a state is read from the trace without seeing the line.
The component follows the theme on the page: the default theme, or the ISA-101 light and dark themes that ship with the package. It declares 4 CSS variables of its own, among them --smart-digital-label-background, --smart-digital-plot-background, --smart-digital-grid-color, --smart-digital-axis-color. The CSS page lists them; the themes guide covers the tokens every component shares.
From a front panel to the browserEvery control and indicator of a test-and-measurement front panel mapped to a component, the mechanical actions, and where the data comes from.
Engineering MathsDSP, statistical process control and series reduction functions, usable without the components.
PerformanceMeasured throughput of the strip chart, scope, trend, alarm grid, heatmap, terminal and audit trail, and how the figures are achieved.