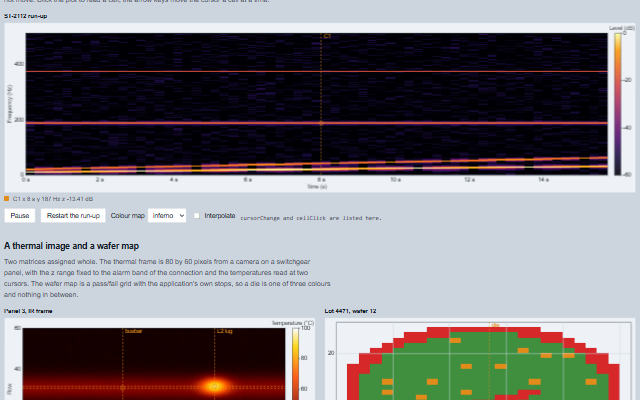
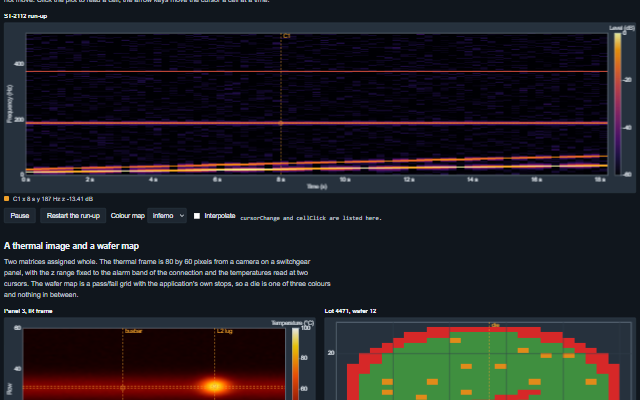
IntensityGraph displays a matrix as colour on an x and a y axis, with a colour ramp that says what the colours mean and cursors that read the cell under them: the display a spectrogram, a thermal image, a die map or a sensor array ends in.
In graph mode the matrix is assigned whole; in chart mode columns are pushed as they arrive and scroll along x. Colour comes from a named map or from the application's own stops, over a z range that follows the data or is fixed. The matrix is drawn once into an image and scaled onto the canvas.
English, German, French, Spanish, Chinese (locale packs)
In the demo: A spectrogram of a machine run-up, as it happens · A thermal image and a wafer map. Open the demo
Quick start
Install the package, load the two stylesheets and the component's module, and put the element on the page. The element below is the first one of the demo. Put the script after the module, in a <script type="module">, so that it runs once the component is defined.
const intensityGraph = document.getElementById('spectrogram');

// raised when a cursor is moved by the operator, with the pointer or the keyboard
intensityGraph.addEventListener('cursorChange', (event) => {
    const { id, x, y } = event.detail;
    // ...
});

// the same values as properties
intensityGraph.historyLength = 240;
intensityGraph.label = 'ST-2112 run-up';
intensityGraph.mode = 'chart';
intensityGraph.xLabel = 'Time';
The properties the demo sets, then the next ones; the API page lists all 28 with their types and defaults.
Name
Type, default
Description
data
array
Sets or retrieves the matrix in graph mode: an array of rows, each an array or typed array of z values. data[row][column]; rows run along y from the bottom, columns along x. A cell that holds no number - null, undefined, an empty string, NaN - is transparent, and the cursors and cellAt read it as missing (z NaN), never as 0.
mode
string graph
Sets or retrieves the mode: graph shows the matrix as assigned; chart scrolls the columns that arrive through push, keeping the newest historyLength of them.
historyLength
number 500
Sets or retrieves the number of columns kept in chart mode.
yMin
number?
Sets or retrieves the y of the first row. Null counts rows from 0.
yMax
number?
Sets or retrieves the y at the end of the last row. Null counts rows from 0.
zMin
number?
Sets or retrieves the z at the bottom of the colour ramp. Null follows the data. In chart mode the range follows the columns on screen, so it moves when the history scrolls. A value below a fixed zMin takes the bottom colour, or underRangeColor when that is set.
zMax
number?
Sets or retrieves the z at the top of the colour ramp. Null follows the data. A value above a fixed zMax takes the top colour, or overRangeColor when that is set.
xLabel
string
Sets or retrieves the name of the x axis.
xUnit
string
Sets or retrieves the unit of the x axis.
yLabel
string
Sets or retrieves the name of the y axis.
yUnit
string
Sets or retrieves the unit of the y axis.
zLabel
string
Sets or retrieves the name of the z axis, shown above the colour ramp.
zUnit
string
Sets or retrieves the unit of z, used in the ramp and the readouts.
colorMap
string viridis
Sets or retrieves the named colour map.
colorStops
array
Sets or retrieves the application's own colour stops, which override the named map: an array of [position, colour] pairs with positions from 0 to 1. Repeating a colour at two positions makes a band, for a pass/fail map.
interpolate
boolean false
Smooths between cells instead of drawing each as a block.
showRamp
boolean true
Shows the colour ramp with its z ticks at the right of the plot.
cursors
array
Sets or retrieves the cursors. Each is an object with id, label, x, y, color and visible. A cursor reads the cell under it into the legend; it is dragged on the plot and moved a cell at a time with the arrow keys.
label
string
Sets or retrieves the title shown above the plot and used in the accessible name.
The events carry their data in event.detail. While interactive is true, the intensity graph moves a cursor in cursors and then raises cursorChange. cellClick reports the cell under a click.
Event
Description and detail
cursorChange
This event is triggered when a cursor is moved by the operator, with the pointer or the keyboard.
idstring The cursor. xnumber Its x. ynumber Its y. znumber The value of the cell under it.
cellClick
This event is triggered when the plot is clicked without dragging.
xnumber The x under the pointer. ynumber The y under the pointer. znumber The value of the cell, or NaN outside the matrix. rownumber The row, or -1. columnnumber The column, or -1.
Methods
Method
Description
push(column, x?)
Appends a column in chart mode: one z per row, newest at the right. The oldest column leaves once historyLength is reached. A missing column (null) is a column of missing cells, and the automatic z range follows the columns held, also once the history is full.
clear()
Empties the chart.
cellAt(x, y) returns object
Returns the cell at a point as { z, row, column }, or null outside the matrix. z is NaN for a cell that holds no number.
describe() returns string
Returns a sentence describing what the graph shows, as used in its accessible name: the shape, the z range and where the highest value is.
In Angular, React, Vue and Blazor
The same element with its wrapper. Each page has the installation steps and the full demo in that framework.
The IntensityGraph is drawn on a canvas, which is not accessible to a screen reader, and it carries its information as colour, which is not available to one either. What the canvas shows is therefore also available as text: the plot area carries a summary with the shape of the matrix, the z range of the colour ramp and where the highest value is, and the cursor legend reads each cursor's x, y and the value of the cell under it. Moving a cursor with the keyboard updates the legend, so a value is read from the display by its coordinates.
The component follows the theme on the page: the default theme, or the ISA-101 light and dark themes that ship with the package. It declares 4 CSS variables of its own, among them --smart-intensity-height, --smart-intensity-plot-background, --smart-intensity-grid-color, --smart-intensity-axis-color. The CSS page lists them; the themes guide covers the tokens every component shares.
From a front panel to the browserEvery control and indicator of a test-and-measurement front panel mapped to a component, the mechanical actions, and where the data comes from.
Engineering MathsDSP, statistical process control and series reduction functions, usable without the components.
PerformanceMeasured throughput of the strip chart, scope, trend, alarm grid, heatmap, terminal and audit trail, and how the figures are achieved.