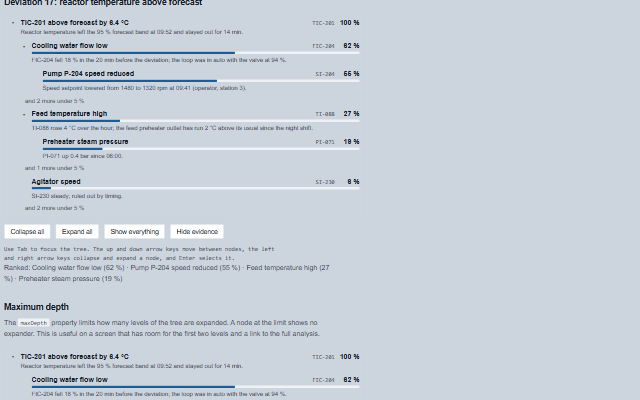
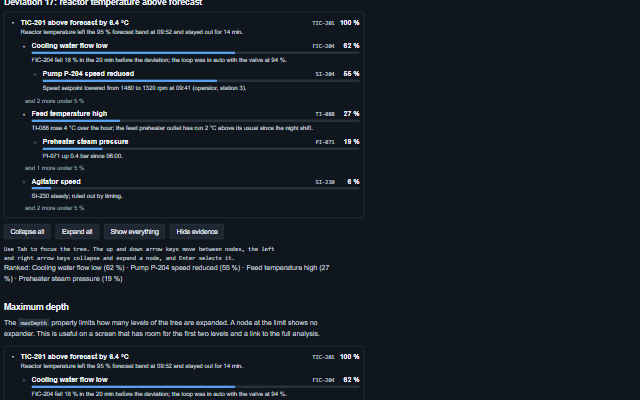
RootCauseTree displays the ranked, nested explanation produced by a root-cause analysis model: the deviation at the root, the contributing conditions below it and their share of the contribution as a bar and a percentage, with the evidence for each node.
Nodes below a configurable share are collapsed into a count. Selecting a node raises the nodeSelect event, where the application can open the underlying data or record a verdict. The arrow keys follow the tree pattern: ArrowRight opens a node or goes to its first child, ArrowLeft closes it or goes to its parent - mirrored on a right-to-left page or with rightToLeft, where the tree is indented from the right and opens towards the left. Contributions are written in the element's locale.
English, German, French, Spanish, Chinese, except the no-reading, range, loop and depth texts, which stay in English (locale packs)
In the demo: Deviation 17: reactor temperature above forecast · Maximum depth. Open the demo
Quick start
Install the package, load the two stylesheets and the component's module, and put the element on the page. The element below is the first one of the demo. Put the script after the module, in a <script type="module">, so that it runs once the component is defined.
const rootCauseTree = document.getElementById('tree');

// raised when a node is selected, clicked, Enter or Space pressed on it, or select()
// called
rootCauseTree.addEventListener('nodeSelect', (event) => {
    const { id, node, path } = event.detail;
    // ...
});

// the same values as properties
rootCauseTree.minContribution = 0.05;
rootCauseTree.label = 'Deviation 17';
The properties the demo sets, then the next ones; the API page lists all 9 with their types and defaults.
Name
Type, default
Description
root
object?
Sets or retrieves the analysis, as { id, label, tag, contribution, evidence, children }, contribution being 0 to 1 and children more of the same. Assign a new object to update the component. A contribution outside 0 to 1 is shown as the number the model gave (300 %, -30 %) with OVER or UNDER beside it and in the spoken name, the bar held inside its track; one that is not a number (missing, NaN, Infinity, text) shows "--" and is spoken "no reading". Neither is ever folded away. A node that is its own ancestor (a loop in the data) is drawn once, with a "Loop back to ..." marker where the loop would start again (Enter on it selects the node it repeats), and the tree is drawn at most 64 levels deep and 5000 nodes, with a note where it is cut; either raises structureWarning once per root and one console warning. The property is not reflected to an attribute.
minContribution
number 0
Sets or retrieves the contribution share below which nodes are collapsed into a count under their parent, for example "and 4 more under 5 %". 0 shows every node. Only a share inside 0 to 1 is folded: a contribution out of range, or none at all, is always shown. A value that is not a number counts as 0.
showEvidence
boolean true
Determines whether each node's evidence is shown under its label.
label
string
Sets or retrieves a name for the analysis, spoken as part of the tree's label.
maxDepth
number 0
Sets or retrieves the number of levels shown below the root. 0 shows every level. A node at the limit shows no expander.
selected
string?
Sets or retrieves the selected node's id, or null.
expandedIds
array?
Sets or retrieves the ids of the nodes shown open. Every node is open until this is set. Assign a new array to update the component.
showTags
boolean true
Determines whether each node's tag is shown beside its label and spoken with it.
sortByContribution
boolean true
Determines whether children are ordered by contribution, largest first, or shown in the order given.
Events
The events carry their data in event.detail. The root cause tree opens or closes a node and then raises expand or collapse, and sets selected and then raises nodeSelect. The application reads the node and its path from event.detail.
Event
Description and detail
nodeSelect
This event is triggered when a node is selected, clicked, Enter or Space pressed on it, or select() called.
idstring The node's id. nodeobject The node as it was given. pathany[] The ids from the root to the node. depthnumber How many levels below the root.
expand
This event is triggered when a node is opened.
idstring The node's id. nodeobject The node as it was given.
collapse
This event is triggered when a node is closed.
idstring The node's id. nodeobject The node as it was given.
structureWarning
This event is triggered once when a root is assigned that cannot be drawn as given: a node that is its own ancestor (a loop) or more than 64 levels. The tree is drawn with markers where it is cut, and nothing is thrown.
reasonsarray What was found: cycle, depth, or both. cyclesarray The loops, as [{ id, parent }]: the node that repeats and the node whose child it is. maxLevelsnumber The most levels drawn, 64.
Methods
Method
Description
nodeById(id) returns any
Returns a node by id, as it was given, or null. A loop in the data is not followed round.
pathTo(id) returns any[]
Returns the nodes from the root to one, root first, empty when the id is not in the tree. A loop in the data is not followed round.
ranked(count?) returns any[]
Returns the causes of the whole tree ranked by contribution, largest first, as [{ id, label, tag, contribution, depth }]. contribution is the number the model gave, outside 0 to 1 too; null where it gave none that is a number, and those come last. A loop in the data is not followed round.
select(id)
Selects a node, expands the path to it, moves focus to it and raises the nodeSelect event.
toggle(id, open?)
Expands or collapses one node and raises the expand or collapse event.
expandAll()
Expands every node.
collapseAll()
Collapses every node except the root.
In Angular, React, Vue and Blazor
The same element with its wrapper. Each page has the installation steps and the full demo in that framework.
The RootCauseTree is exposed as a WAI-ARIA tree: one tab stop, the up and down arrow keys move between nodes, and the left and right arrow keys collapse and expand them. Each node is named by its label, its share and its tag, for example "Cooling water flow low, 62 %, FIC-204", so the bar, which shows the same number, is not the only way to read it. The evidence under a label is plain text in the node and is read after the name. Nodes hidden by minContribution are reported: a line under their parent states how many there are and the share they fall under, so the tree is not read as complete when it is not.
Roles: "group""tree""treeitem""none"
Key
Action
Tab
Moves into the tree, landing on the selected node or the root, and out again. The tree is one stop.
Arrow Down / Arrow Up
Moves to the next / previous visible node.
Arrow Right
On a closed node, opens it, raising expand; on an open node, moves to its first child.
Arrow Left
On an open node, closes it, raising collapse; on a closed node or a leaf, moves to its parent.
Home / End
Moves to the first / last visible node.
Enter or Space
Selects the node, raising nodeSelect with the path from the root, the same event a click raises.
The component follows the theme on the page: the default theme, or the ISA-101 light and dark themes that ship with the package. It declares 4 CSS variables of its own, among them --smart-rct-indent, --smart-rct-bar-height, --smart-rct-bar-color, --smart-rct-line-color. The CSS page lists them; the themes guide covers the tokens every component shares.