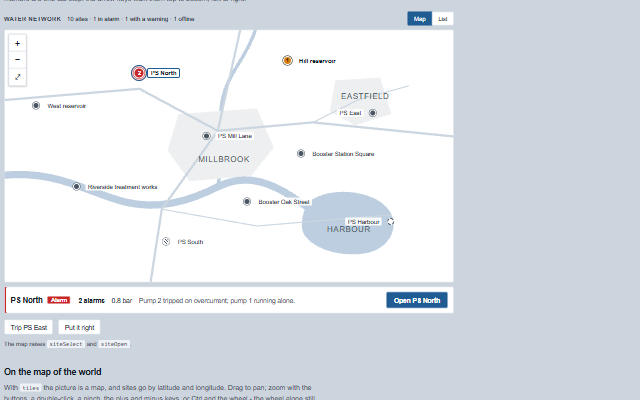
SiteMap puts many sites on one picture - the pump stations of a water network, the turbines of a wind farm, the substations of a grid - so that "where is something wrong" is answered with a place.
The picture is the plant's own (an image, or an SVG placed inside the element that takes the theme's colours, with sites by percent) or the world: map tiles from any tile server named in tiles, with sites by latitude and longitude, drawn muted so the sites and not the streets are what the eye finds. Nothing is fetched until tiles is set, and a plant can point it at its own tile server. Either picture pans with a drag and zooms with the buttons, a pinch, a double-click, the plus and minus keys, or Ctrl and the wheel. A site that is fine is neutral grey; colour, the alarm count and a heavier mark are only for a site that needs someone. A site's card opens under the map or beside its marker, with Open for its own screen and a link when it has one; readings, states and alarm counts follow tags through push(). A summary line counts what is wrong, the markers are one tab stop walked with the arrow keys, and the same sites are a table one click away, worst first. The arrow keys walk the markers in reading order: top to bottom, then left to right - or right to left on a right-to-left page or with rightToLeft, where ArrowLeft is the next site and ArrowRight the previous. Right to left (rightToLeft, or a right-to-left page) the heading, the table and the cards mirror; the map itself does not - geography and a plant's picture have no reading direction. Readings are formatted in the element's locale.
Tag
<smart-site-map>
Module
smart-industrial/source/modules/smart.sitemap.js
Angular
SiteMapModule from smart-industrial/angular/sitemap
English, German, French, Spanish, Chinese, except the unknown and maintenance counts and the no-reading text, which stay in English (locale packs)
In the demo: A water network · On the map of the world · The same sites as a table · and more. Open the demo
Quick start
Install the package, load the two stylesheets and the component's module, and put the element on the page. The element below is the first one of the demo. Put the script after the module, in a <script type="module">, so that it runs once the component is defined.
const siteMap = document.getElementById('network');

// raised by the Open button of the selected site, for the application to go to that site's
// screen
siteMap.addEventListener('siteOpen', (event) => {
    const { id } = event.detail;
    // the component waits: carry out the request, then set the property from the result
});

// the same values as properties
siteMap.label = 'Water network';
siteMap.aspectRatio = '16 / 9';
siteMap.selected = 'ps-north';
The properties the demo sets, then the next ones; the API page lists all 16 with their types and defaults.
Name
Type, default
Description
sites
array
Sets or retrieves the sites as [{ id, name, x, y, lat, lon, state, alarms, reading, unit, description, href }]. On a picture, x and y are percent from its top left; with tiles, lat and lon place the site. state is normal, warning, alarm, offline or maintenance, in any case and with spaces round it ignored - or an alarm bit (1 or true is alarm, 0 or false normal), or the whole number 2 warning, 3 offline, 4 maintenance. Anything else - no state, an empty string, another word such as stale, a number outside 0 to 4 or not whole - is unknown: drawn as a hollow dotted marker with a question mark, named "State unknown", counted in the summary line and sorted in the table straight after warning (alarm, warning, unknown, offline, maintenance, normal), so a site whose state cannot be read never passes for normal. "All normal" is said only when every site is normal. A numeric reading is shown with unit; a reading that is there but is no reading (NaN, Infinity, null, an object, "NaN") shows "--" and is spoken "no reading"; a site without a reading shows none. href adds a link to the site's card (http, https or a path; nothing else is made a link). Assign a new array to update the component; readings, states and alarm counts can also come through push(). An item that is not a site (null, a number, an object with neither id nor name) is skipped with one console warning; a site with a name and no id goes by its name.
label
string
Sets or retrieves the heading of the map. It is also the accessible name of the group.
wheelZoom
string ctrl
Sets or retrieves what the mouse wheel does over the map: zoom only with Ctrl held, as a page the map is only part of needs (the wheel alone scrolls the page, and a hint says how to zoom); always; or never.
aspectRatio
string 16 / 9
Sets or retrieves the picture's width to height, as CSS aspect-ratio has it.
selected
string
Sets or retrieves the id of the selected site, which is shown under the map.
showLabels
boolean true
Sets or retrieves whether every site is named beside its marker. Off, only the selected site and those that need someone are named.
background
string
Sets or retrieves the URL of an image under the sites. Without one, an SVG placed inside the element is the picture, and without that the sites sit on a grid.
tiles
string
Sets or retrieves the URL of the map tiles, with {z}, {x} and {y}, and optionally {s} for a subdomain - https://tile.openstreetmap.org/{z}/{x}/{y}.png, or a plant's own tile server. With tiles, sites are placed by lat and lon. Nothing is fetched while it is empty.
tileSubdomains
string abc
Sets or retrieves the letters {s} in tiles takes, one per tile in turn.
attribution
string
Sets or retrieves the tile provider's credit, shown in the corner of the map. OpenStreetMap's own is shown when tiles come from it and this is empty.
The events carry their data in event.detail. siteSelect, viewChange and mapMove report what the site map has already done: it sets selected or view, or pans and zooms its own view, and then raises the event. siteOpen is a request: the site map changes nothing and the application opens the screen for the site.
Event
Description and detail
siteSelect
This event is triggered when a site is selected on the map or in the table - or deselected, with an empty id, when its card is closed.
idstring The id of the site.
siteOpen
This event is triggered by the Open button of the selected site, for the application to go to that site's screen.
idstring The id of the site.
mapMove
This event is triggered when the map has been panned or zoomed, once the movement stops - with the view as getView() gives it, for an application that keeps where an operator left the map.
zoomnumber The zoom. centerobject The center: { lat, lon } with tiles, { x, y } in percent on a picture.
viewChange
This event is triggered when the operator switches between the map and the table.
viewstring map or list.
Methods
Method
Description
push(record)
Changes readings, states and alarm counts as they arrive, without re-sending the list: { '<site id>.reading': 4.2, '<site id>.state': 1 }. The record a strip chart's push takes, so Connect.stream() feeds a map as it feeds a chart. A new sites array drops what push brought for the old one. A state goes through the same reading as in sites: a word or code the map does not know makes the site unknown, not normal.
fit()
Shows every site: the closest zoom at which they all fit.
zoomIn()
Zooms in a step at the middle of the map.
zoomOut()
Zooms out a step.
getView() returns object
Returns where the map is looking: { zoom, center: { lat, lon } } with tiles, { zoom, center: { x, y } } on a picture.
In Angular, React, Vue and Blazor
The same element with its wrapper. Each page has the installation steps and the full demo in that framework.
A map is a picture, and a picture is not enough on its own. The SiteMap gives three ways in: a summary line that counts what is wrong - "10 sites · 1 in alarm · 1 with a warning · 1 offline" - markers that are buttons named in full, and the same sites as a table, worst first, one click away. A site's state is written in its name, its marker shape and weight change with it, and colour is only one of the three.
Roles: "group"
Key
Action
Tab
Moves to the Map and List buttons, then to the markers as one stop, then to Open.
Arrow keys
Walk the markers in reading order - top to bottom, left to right - and wrap at the ends.
Home / End
Go to the first and last site.
Enter or Space
Selects the site, which raises siteSelect and shows its card.
+ and -
Zoom in and out at the focused site; 0 shows every site again.
Escape
Closes the card beside a marker, and focus returns to the site.
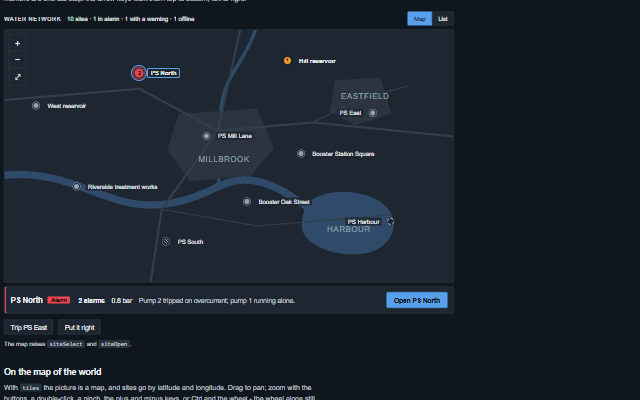
The component follows the theme on the page: the default theme, or the ISA-101 light and dark themes that ship with the package. It declares 8 CSS variables of its own, among them --smart-site-map-normal, --smart-site-map-warning, --smart-site-map-alarm, --smart-site-map-alarm-color. The CSS page lists them; the themes guide covers the tokens every component shares.