Build your web apps using Smart Custom Elements
Smart 3d Chart - configuration and usage
3D Chart Formatting
Smart 3d Chart allows you to format text in two different ways. The first approach is to use the formatSettings property which is available for each series group, series, and axis. The series and series group settings affect the formatting of labels and tooltips. The axis format settings affect the formatting of the labels displayed along the axis.
The formatSettings property provides the following options:
- decimalSeparator - character used as a decimal separator. If not specified, the default separator is '.'
- thousandsSeparator - character used as thousands separator. Default value is ','
- decimalPlaces - number of digits after the decimal separator. Default value is 2 for floating point numbers.
- negativeWithBrackets - boolean which specifies whether to display negative numbers in brackets. Default value is false.
- prefix - any string which will be added as a prefix. Default value is empty.
- sufix - any string which will be added as a sufix. Default value is empty.
- dateFormat - optional date format string. This property is applicable only when displaying Date objects.
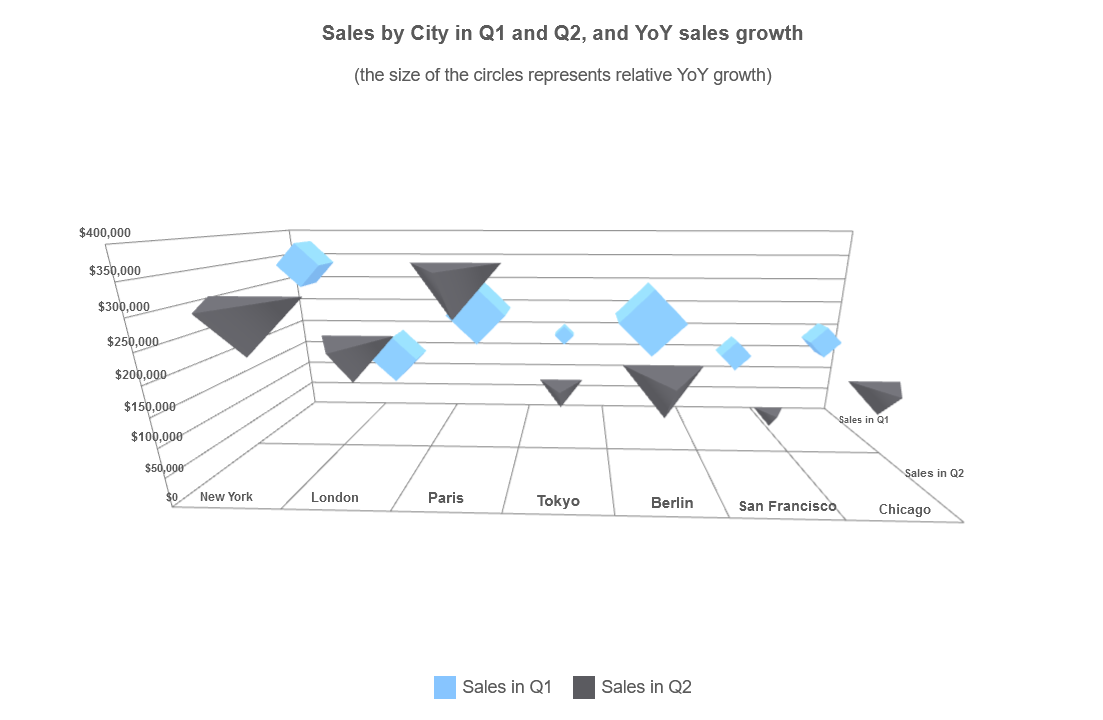
All fields in the formatSettings object are optional. For example the following code will format the labels of the Y-axis as dollar values:
valueAxis:
{
    labels: {
        formatSettings: {
            prefix: '$',
            thousandsSeparator: ','
        }
    }
}
The same effect can also be achieved with the formatFunction property:
valueAxis:
{
    formatFunction: (value) => {
        var formatter = new Intl.NumberFormat('en-US', {
          style: 'currency',
          currency: 'USD',
          maximumFractionDigits: 0
        });

        return formatter.format(value);
    },
}
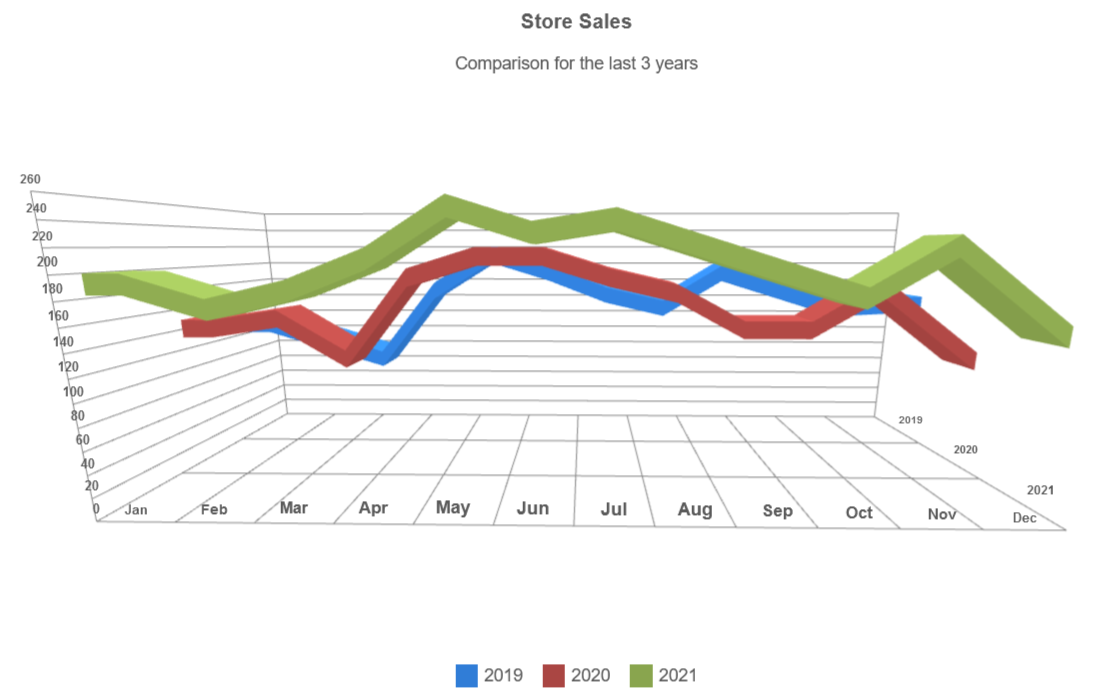
The formatFunction is more powerful, as it allows you to use a custom text formatting callback function written in JavaScript. The function is required to accept at least one parameter which is the value that will be formatted. Smart 3d Chart will call the function every time it needs to format and display a value. You can specify a custom format function for each series group, serie or axis. The following example is a simple format function which returns the month for a given date value:
xAxis:
{
    labels: {
        formatFunction: function (value) {
            const months = ["Jan", "Feb", "Mar", "Apr", "May", "Jun", "Jul", "Aug", "Sep", "Oct", "Nov", "Dec"];
            return months[value];
        }
    }
}
Please note that if formatFunction is implemented for a particular chart part, formatSettings has no effect.
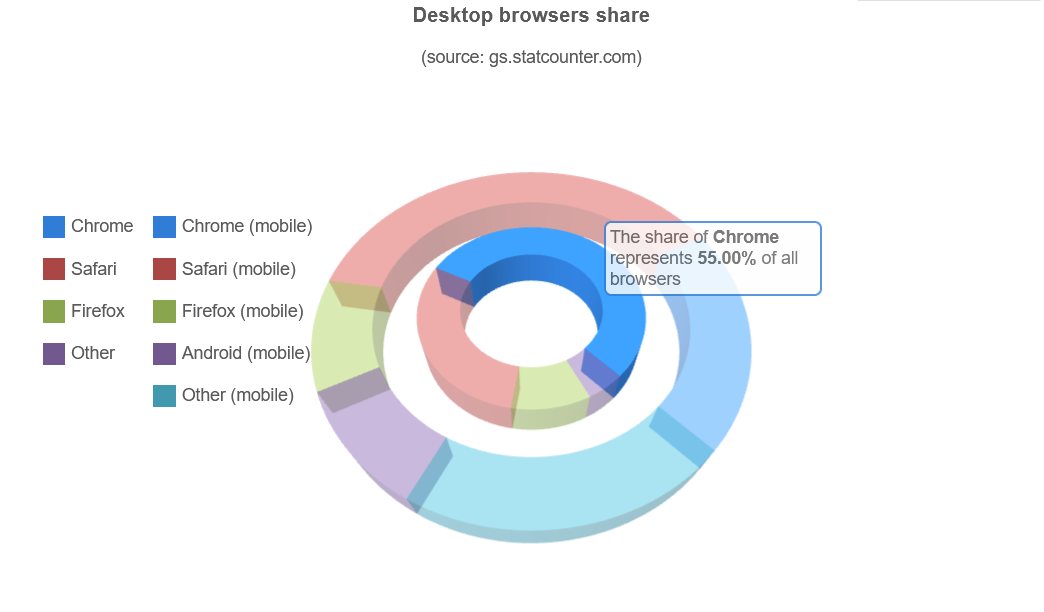
Tooltip Formatting
In order to format the tooltips, you can use toolTipFormatSettings and toolTipFormatFunction which work the same way as formatSettings and formatFunction. The callback toolTipFormatFunction accepts several parameters - the value of the highlighted item, its repective item, serie and grop indexes, as well as the values on the X and Z-axis if there are such.
toolTipFormatFunction: (value, itemIndex, serie, group, xAxisValue) => {
    return `The share of <b>${xAxisValue}</b> represents <b>${value.toFixed(2)}%</b> of all browsers`;
}
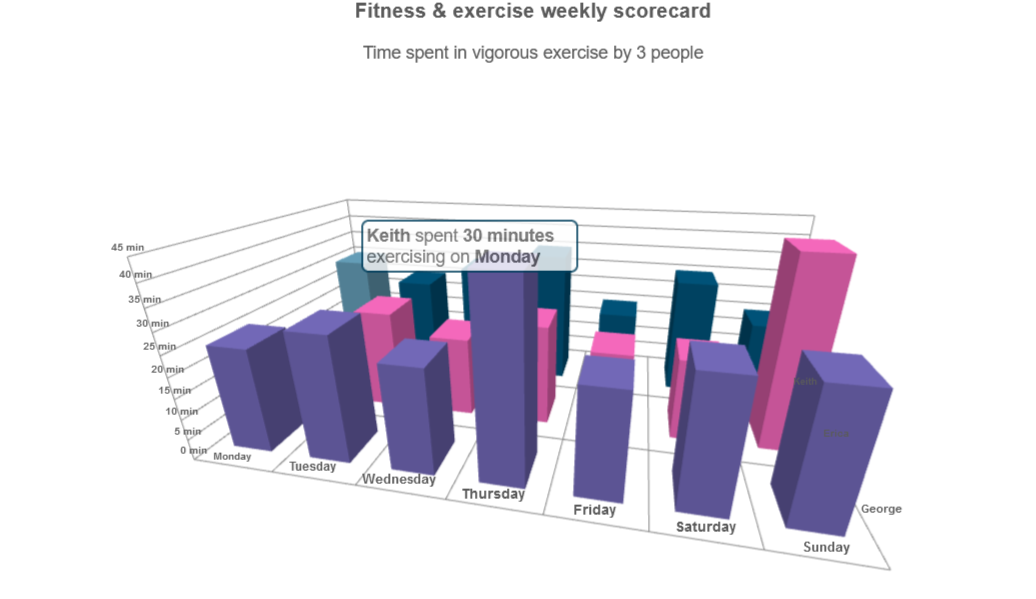
Formatting Example
The following code example features several parts of the chart being formatted using the aforementioned methods. The resulting Smart 3d Chart is shown in an image at the bottom.
<!DOCTYPE html>
<html xmlns="http://www.w3.org/1999/xhtml">
<head>
    <title>3D Chart Formatting Example</title>
    <link rel="stylesheet" type="text/css" href="../../../source/styles/smart.default.css" />
    <script type="text/javascript" src="https://cdnjs.cloudflare.com/ajax/libs/webcomponentsjs/2.2.7/webcomponents-bundle.js"></script>
    <script type="text/javascript" src="../../../source/smart.element.js"></script>
    <script type="text/javascript" src="../../../source/smart.elements.js"></script>
    <script type="text/javascript">
        const sampleData = [
            { Day: "Monday", Keith: 30, Erica: 15, George: 25 },
            { Day: "Tuesday", Keith: 25, Erica: 25, George: 30 },
            { Day: "Wednesday", Keith: 30, Erica: 20, George: 25 },
            { Day: "Thursday", Keith: 35, Erica: 25, George: 45 },
            { Day: "Friday", Keith: 20, Erica: 20, George: 25 },
            { Day: "Saturday", Keith: 30, Erica: 20, George: 30 },
            { Day: "Sunday", Keith: 20, Erica: 45, George: 30 },
        ];

        Smart(
            "#3d-chart",
            class {
            get properties() {
                return {
                caption: "Fitness & exercise weekly scorecard",
                description: "Time spent in vigorous exercise by 3 people",
                showLegend: true,
                cameraPosition: {
                    x: 15,
                    y: 30,
                    z: 70,
                },
                dataSource: sampleData,
                colorScheme: "scheme29",
                toolTipFormatFunction: (value, itemIndex, serie, group, xAxisValue, zAxisValue) => {
                    return `<b>${zAxisValue}</b> spent <b>${value} minutes</b> exercising on <b>${xAxisValue}</b>`;
                },
                xAxis: {
                    dataField: "Day",
                },
                valueAxis: {
                    unitInterval: 5,
                    formatSettings: {
                    sufix: " min",
                    }
                },
                seriesGroups: [
                    {
                    type: "column",

                    series: [
                        { dataField: "Keith", displayText: "Keith" },
                        { dataField: "Erica", displayText: "Erica" },
                        { dataField: "George", displayText: "George" },
                    ],
                    },
                ],
                };
            }
            }
        );
    </script>
</head>
<body>
    <smart-3d-chart id="3d-chart"></smart-3d-chart>
</body>
</html>