Smart.Chart Formatting
Setup The Blazor Application
Follow the Getting Started guide to set up your Blazor Application with Smart UI.
Setup the Blazor Smart.Chart
Follow the Get Started with Smart.Chart guide to set up the component.
Formatting
Smart.Chart allows you to format text using the FormatSettings property which is available for each series group, series, and axis. The series and series group settings affect the formatting of labels and tooltips. The axis format settings affect the formatting of the labels displayed along the axis.
The FormatSettings property provides the following options:
- DecimalSeparator - character used as a decimal separator. If not specified, the default separator is '.'
- ThousandsSeparator - character used as thousands separator. Default value is ','
- DecimalPlaces - number of digits after the decimal separator. Default value is 2 for floating point numbers.
- NegativeWithBrackets - boolean which specifies whether to display negative numbers in brackets. Default value is false.
- Prefix - any string which will be added as a prefix. Default value is empty.
- Sufix - any string which will be added as a sufix. Default value is empty.
- DateFormat - optional date format string. This property is applicable only when displaying Date objects.
    FormatSettings = new ChartFormatSettings()
    {
         DecimalPlaces = 0,
         Sufix = "°C"
    }
Tooltip Formatting
In order to format the tooltips, you can use ToolTipFormatSettings that works the same way as FormatSettings.
Here is an example:
    ToolTipFormatSettings = new ChartFormatSettings()
    {
        DecimalPlaces = 0,
        Sufix = "°C"
    }
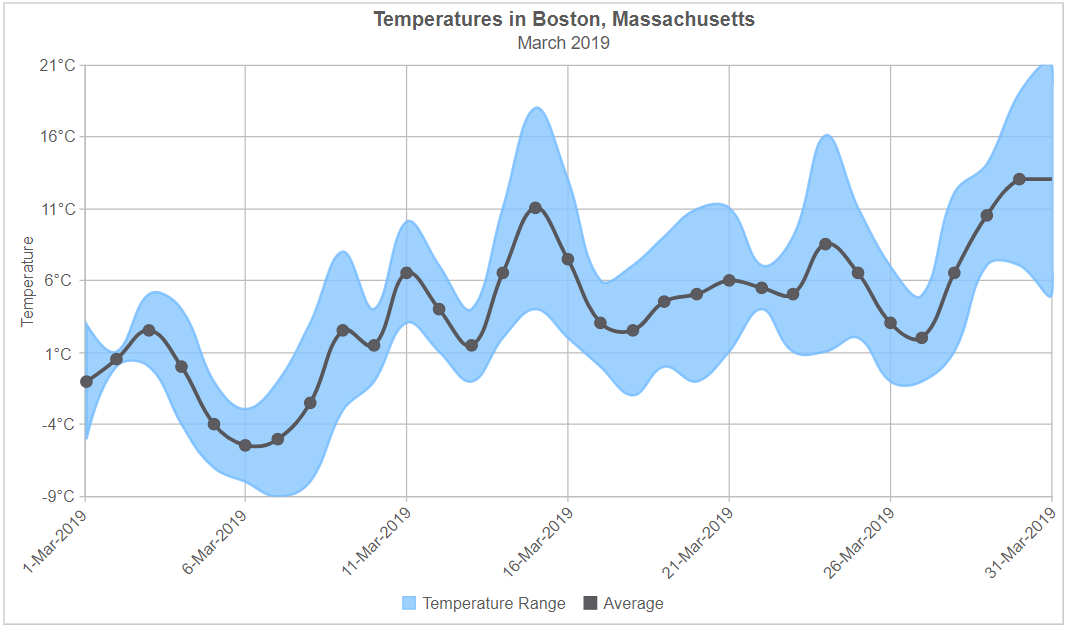
Example
The following code example features several parts of the chart being formatted using the aforementioned properties.
    <Chart DataSource="sampleData" Caption="Temperatures in Boston, Massachusetts" Description="March 2019" EnableCrosshairs
        ShowToolTipsOnAllSeries ShowLegend Padding="new Padding() { Left = 10, Top = 5, Right = 10, Bottom = 5 }" ColorScheme="ChartColorScheme.Scheme32"
        TitlePadding="new Padding() { Left = 50, Top = 0, Right = 0, Bottom = 10 }" XAxis="xAxis" ValueAxis="valueAxis" SeriesGroups="seriesGroups" />

    @code {
        List<Dictionary<string, object>> sampleData = new List<Dictionary<string, object>>()
        {
            new Dictionary<string, object> { { "Date", new DateTime(2019, 3, 1) }, { "Low", -5 }, { "High", 3 } },
            new Dictionary<string, object> { { "Date", new DateTime(2019, 3, 2) }, { "Low", 0 }, { "High", 1 } },
            new Dictionary<string, object> { { "Date", new DateTime(2019, 3, 3) }, { "Low", 0 }, { "High", 5 } },
            new Dictionary<string, object> { { "Date", new DateTime(2019, 3, 4) }, { "Low", -4 }, { "High", 4 } },
            new Dictionary<string, object> { { "Date", new DateTime(2019, 3, 5) }, { "Low", -7 }, { "High", -1 } },
            new Dictionary<string, object> { { "Date", new DateTime(2019, 3, 6) }, { "Low", -8 }, { "High", -3 } },
            new Dictionary<string, object> { { "Date", new DateTime(2019, 3, 7) }, { "Low", -9 }, { "High", -1 } },
            new Dictionary<string, object> { { "Date", new DateTime(2019, 3, 8) }, { "Low", -8 }, { "High", 3 } },
            new Dictionary<string, object> { { "Date", new DateTime(2019, 3, 9) }, { "Low", -3 }, { "High", 8 } },
            new Dictionary<string, object> { { "Date", new DateTime(2019, 3, 10) }, { "Low", -1 }, { "High", 4 } },
            new Dictionary<string, object> { { "Date", new DateTime(2019, 3, 11) }, { "Low", 3 }, { "High", 10 } },
            new Dictionary<string, object> { { "Date", new DateTime(2019, 3, 12) }, { "Low", 1 }, { "High", 7 } },
            new Dictionary<string, object> { { "Date", new DateTime(2019, 3, 13) }, { "Low", -1 }, { "High", 4 } },
            new Dictionary<string, object> { { "Date", new DateTime(2019, 3, 14) }, { "Low", 2 }, { "High", 11 } },
            new Dictionary<string, object> { { "Date", new DateTime(2019, 3, 15) }, { "Low", 4 }, { "High", 18 } },
            new Dictionary<string, object> { { "Date", new DateTime(2019, 3, 16) }, { "Low", 2 }, { "High", 13 } },
            new Dictionary<string, object> { { "Date", new DateTime(2019, 3, 17) }, { "Low", 0 }, { "High", 6 } },
            new Dictionary<string, object> { { "Date", new DateTime(2019, 3, 18) }, { "Low", -1 }, { "High", 7 } },
            new Dictionary<string, object> { { "Date", new DateTime(2019, 3, 19) }, { "Low", 0 }, { "High", 9 } },
            new Dictionary<string, object> { { "Date", new DateTime(2019, 3, 20) }, { "Low", -1 }, { "High", 11 } },
            new Dictionary<string, object> { { "Date", new DateTime(2019, 3, 21) }, { "Low", 1 }, { "High", 11 } },
            new Dictionary<string, object> { { "Date", new DateTime(2019, 3, 22) }, { "Low", 4 }, { "High", 7 } },
            new Dictionary<string, object> { { "Date", new DateTime(2019, 3, 23) }, { "Low", 1 }, { "High", 9 } },
            new Dictionary<string, object> { { "Date", new DateTime(2019, 3, 24) }, { "Low", 1 }, { "High", 16 } },
            new Dictionary<string, object> { { "Date", new DateTime(2019, 3, 25) }, { "Low", 2 }, { "High", 11 } },
            new Dictionary<string, object> { { "Date", new DateTime(2019, 3, 26) }, { "Low", -1 }, { "High", 7 } },
            new Dictionary<string, object> { { "Date", new DateTime(2019, 3, 27) }, { "Low", -1 }, { "High", 5 } },
            new Dictionary<string, object> { { "Date", new DateTime(2019, 3, 28) }, { "Low", 1 }, { "High", 12 } },
            new Dictionary<string, object> { { "Date", new DateTime(2019, 3, 29) }, { "Low", 7 }, { "High", 14 } },
            new Dictionary<string, object> { { "Date", new DateTime(2019, 3, 30) }, { "Low", 7 }, { "High", 19 } },
            new Dictionary<string, object> { { "Date", new DateTime(2019, 3, 31) }, { "Low", 5 }, { "High", 21 } }
        };

        ChartXAxis xAxis = new ChartXAxis()
        {
            DataField = "Date",
            Type = ChartXAxisType.Date,
            BaseUnit = ChartBaseUnit.Day,
            Labels = new ChartLabels()
            {
                Angle = -45,
                RotationPoint = ChartRotationPoint.Topright,
                Offset = new Offset() { X = -25, Y = 0 }
            }
        };

        ChartValueAxis valueAxis = new ChartValueAxis()
        {
            Title = new ChartTitle() { Text = "Temperature" },
            FormatSettings = new ChartFormatSettings()
            {
                DecimalPlaces = 0,
                Sufix = "°C"
            }
        };

        List<ChartSeriesGroup> seriesGroups = new List<ChartSeriesGroup>()
        {
            new ChartSeriesGroup()
            {
                Type = ChartType.Splinerangearea,
                Series = new List<ChartSeriesGroupSerie>()
                {
                    new ChartSeriesGroupSerie()
                    {
                        DataFieldFrom = "Low",
                        DataFieldTo = "High",
                        DisplayText = "Temperature Range",
                        Opacity = 0.8f,
                        ToolTipFormatSettings = new ChartFormatSettings()
                        {
                            DecimalPlaces = 0,
                            Sufix = "°C"
                        }
                    }
                }
            },
            new ChartSeriesGroup()
            {
                Type = ChartType.Spline,
                Series = new List<ChartSeriesGroupSerie>()
                {
                    new ChartSeriesGroupSerie()
                    {
                        DataField = "Average",
                        SymbolType = ChartSymbolType.Circle,
                        SymbolSize = 9,
                        SymbolSizeSelected = 9,
                        ToolTipFormatSettings = new ChartFormatSettings()
                        {
                            DecimalPlaces = 0,
                            Sufix = "°C"
                        }
                    }
                }
            }
        };

        protected override void OnInitialized()
        {
            base.OnInitialized();

            for(int i = 0; i < sampleData.Count; i++)
            {
                sampleData[i]["Average"] = (int.Parse(sampleData[i]["High"].ToString()) + int.Parse(sampleData[i]["Low"].ToString())) / 2;
            }
        }
    }
Result: