Build your web apps using Smart Custom Elements
Smart 3d Chart - configuration and usage
3D Chart Styling
Smart 3d Chart offers many options to customize the chart appearance and colors. In this section we will go through the styling options available in different chart elements.
Themes
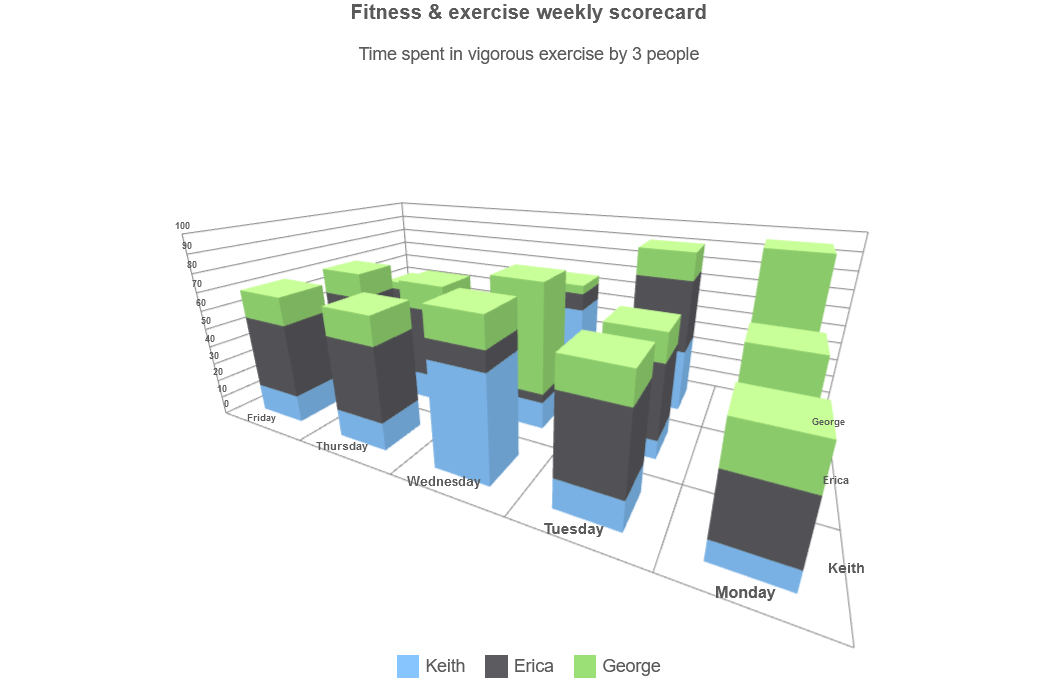
Smart 3d Chart themes are sets of background, line, text and band colors that will be used in the 3D Chart by default, if no further customizations are made. There are two themes - 'light' (default) and 'dark' that can be applied by setting the theme property.
The following images show the same 3D Chart with 'light' and 'dark' theme respectively in combination with the backgroundColor property:
 |
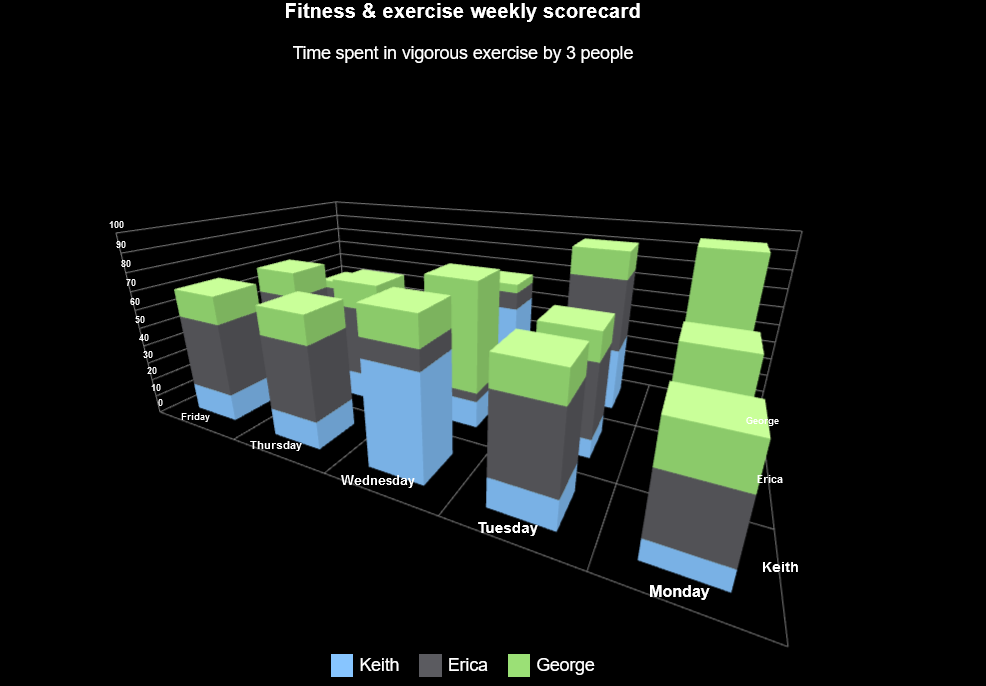 |
| theme: 'light' | theme: 'dark' |
Color Schemes
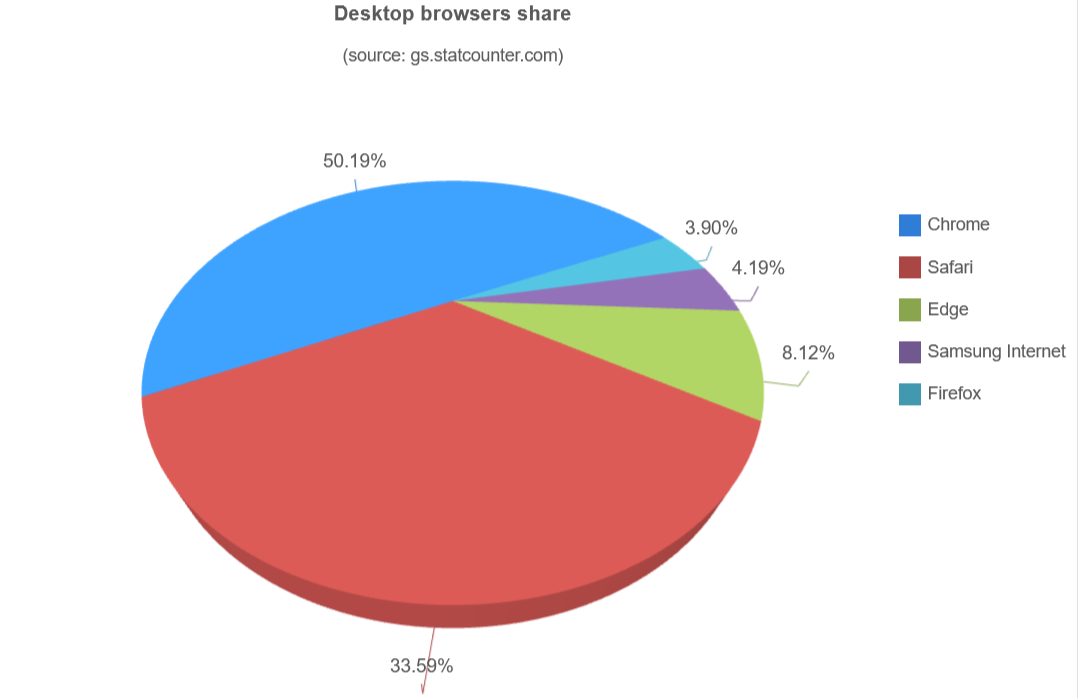
Smart 3d Chart also ships with 32 built-in color schemes which are used to automatically set colors for different series. You can change the color scheme by setting the colorScheme property of the chart. The available value are from 'scheme01' to 'scheme32'.
The following images show the same 3D Chart with two different color schemes applied:
 |
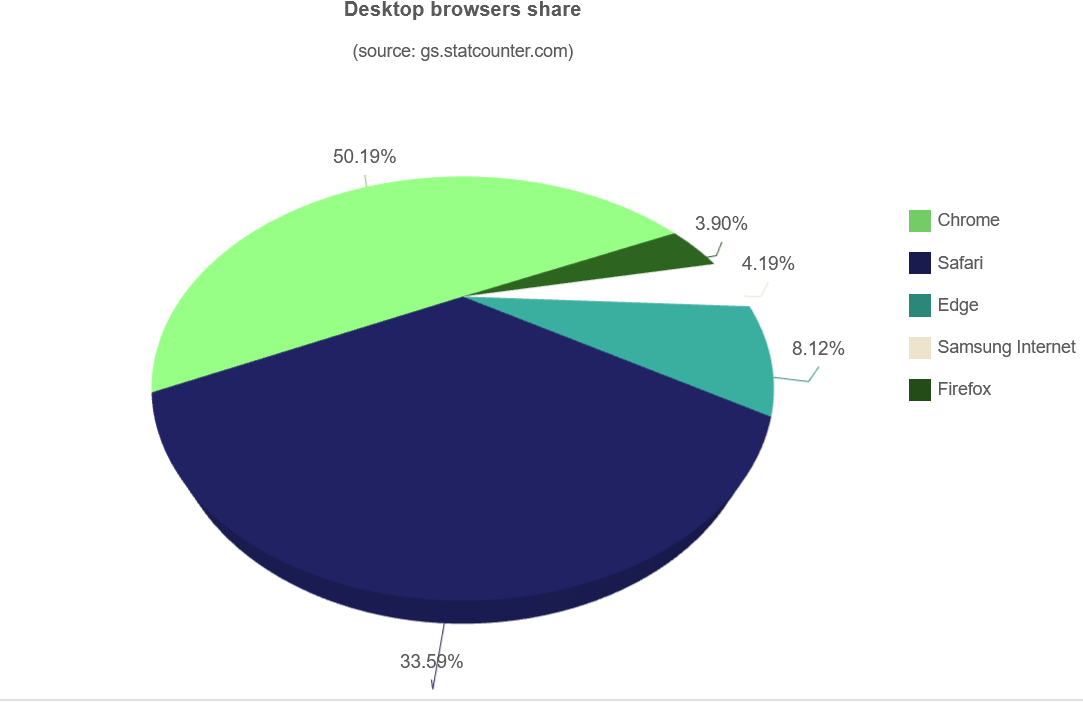 |
| colorScheme: 'scheme01' | colorScheme: 'scheme31' |
Custom color schemes can also be applied by adding them with the addColorScheme method:
const chart = document.querySelector('smart-3d-chart');
chart.addColorScheme('myScheme', ['#1A6642', '#46C26F', '#F9B956', '#F38443', '#DE513D']);
chart.colorScheme = 'myScheme';
Custom Series Colors
The colors can be furter customized via the following properties, available to both Series and Serie Groups:
- fillColor - fill color for the serie.
- fillColorAlt - alternating fill color for the serie. Applicable to OHLC series only.
- outlineColor - outline color for the serie.
- outlineColorWidth - the width of the outline color for the serie.
- legendFillColor - fill color of the legend box. The default value is inherited from the serie or serie group's color.
- legendLineColor - line color of the legend box. The default value is inherited from the serie or serie group's color.
- toolTipLineColor - determines the tooltip's border lines color. The default value is inherited from the item's color.
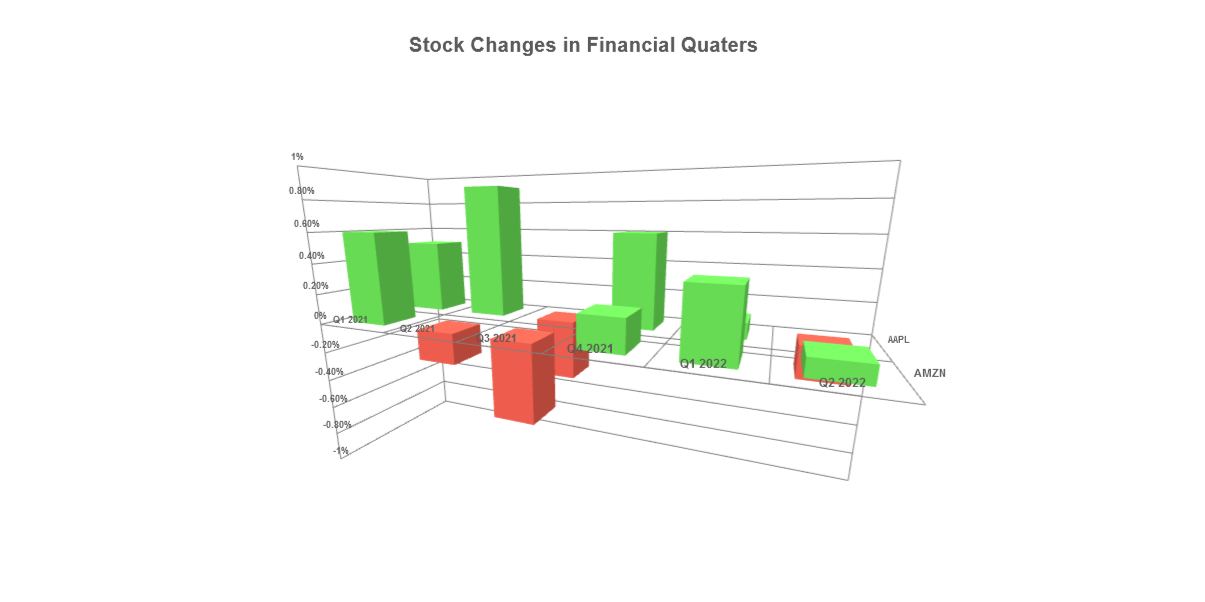
Conditional colors can also be applied by implementing the callback function colorFunction.
In the following example, some of these settings are demonstrated:
<!DOCTYPE html>
<html xmlns="http://www.w3.org/1999/xhtml">
<head>
    <title>Custom Series Colors Example</title>
    <link rel="stylesheet" type="text/css" href="../../../source/styles/smart.default.css" />
    <script type="text/javascript" src="https://cdnjs.cloudflare.com/ajax/libs/webcomponentsjs/2.2.7/webcomponents-bundle.js"></script>
    <script type="text/javascript" src="../../../source/smart.element.js"></script>
    <script type="text/javascript" src="../../../source/smart.elements.js"></script>
    <script>
        const sampleData = [
            { Month: "Q1 2021", AAPL: 0.5, AMZN: 0.6 },
            { Month: "Q2 2021", AAPL: 0.9, AMZN: -0.2 },
            { Month: "Q3 2021", AAPL: -0.4, AMZN: -0.5 },
            { Month: "Q4 2021", AAPL: 0.6, AMZN: 0.2 },
            { Month: "Q1 2022", AAPL: 0.1, AMZN: 0.4 },
            { Month: "Q2 2022", AAPL: -0.2, AMZN: 0.1 },
        ];

        Smart(
            "#chart",
            class {
            get properties() {
                return {
                caption: "Stock Changes in Financial Quaters",
                description: "",
                showLegend: false,
                cameraPosition: {
                    x: 30,
                    y: 50,
                    z: 70,
                },
                dataSource: sampleData,
                xAxis: {
                    dataField: "Month",
                },
                valueAxis: {
                    unitInterval: 0.20,
                    minValue: -1,
                    maxValue: 1,
                    formatSettings: {
                    sufix: "%",
                    }
                },
                seriesGroups: [
                    {
                    type: "column",

                    series: [
                        { dataField: "AAPL", displayText: "AAPL" },
                        { dataField: "AMZN", displayText: "AMZN" },
                    ],
                    colorFunction: function (value, itemIndex, serie, group) {
                        return (value < 0) ? '#E25848' : '#61D14F';
                    }

                    },
                ],
                };
            }
            }
        );
    </script>
</head>
<body>
    <smart-3d-chart id="chart"></smart-3d-chart>
</body>
</html>
Custom 3D Models
Smart 3D Chart supports importing 3D Models in the .glTF/.glb file formats, by utilizing ThreeJS's GLTFLoader.
The 3D Models are set in the customModels property as an array of {groupIndex, serieIndex, itemIndex, modelUrl} objects. Example:
customModels: [
    {groupIndex: 0, serieIndex: 0, itemIndex: 0, model: '../../images/free__la_tour_eiffel.glb'},
    {groupIndex: 0, serieIndex: 0, itemIndex: 1, model: '../../images/gulas_cn_tower.glb'},
    {groupIndex: 0, serieIndex: 0, itemIndex: 2, model: '../../images/shanghai_tower.glb'},
    {groupIndex: 0, serieIndex: 0, itemIndex: 3, model: '../../images/burj_khalifa.glb'},
    {groupIndex: 0, serieIndex: 0, itemIndex: 4, model: '../../images/one_world_trade_center.glb'},
    {groupIndex: 0, serieIndex: 0, itemIndex: 5, model: '../../images/empire_state_building.glb'},
],
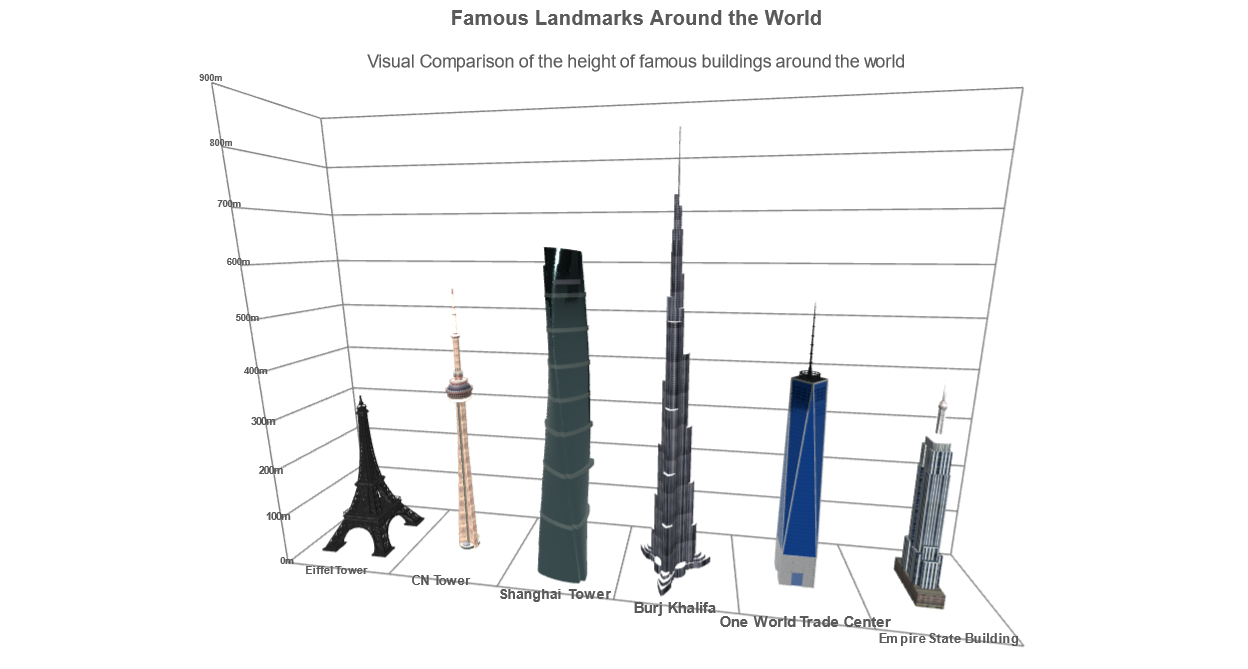
The following 3D Models were used in the example:
- Eiffel Tower is based on "La tour Eiffel" by SDC PERFORMANCE licensed under CC-BY-4.0
- CN Tower is based on "Gula's CN Tower" by gula licensed under CC-BY-4.0
- Shanghai Tower is based on "Shanghai Tower" by NanoRay licensed under CC-BY-4.0
- Burj Khalifa is based on "Burj Khalifa" by ManySince910 licensed under CC-BY-4.0
- One World Trade Center is based on "One World Trade Center" by NanoRay licensed under CC-BY-4.0
- Empire State Building is based on "Empire State Building" by Brad Cole licensed under CC-BY-4.0
Grid lines
You can adjust the spacing and colors of the horizontal and vertical grid lines. The vertical gridlines can be adjusted by changing the xAxis.gridLines options.
For example the following code makes the Z-Axis invinsible and sets the color of the X and Value-Axis to 'lightgray':
valueAxis:
{
    gridLines: {
        visible: false,
        color: 'lightgray'
    }
},
xAxis:
{
    gridLines: {
        visible: true,
        color: 'lightgray'
    }
},
zAxis:
{
    gridLines: {
        visible: false,
    }
},
Border Line Color, Background Color
You can change the chart's border color by setting the borderLineColor property:
const chart = document.querySelector('smart-3d-chart');
chart.borderLineColor = '#0000FF';
The chart's default background color can be changed by setting the backgroundColor property:
const chart = document.querySelector('smart-3d-chart');
chart.backgroundColor = '#97D1E5';
Styling Through CSS
Some parts of Smart 3d Chart can be styled through CSS. Here is an overview:
CSS variables for 3D Chart styling:
- --smart-font-family - font-family of text in the 3D Chart.
- --smart-font-size - font-size of caption text. The font-size of all other text parts is also relative to this variable.
- --smart-border - border color of the 3D Chart.
- --smart-border-radius - border-radius of the 3D Chart's tooltip.
The following CSS selectors can be used to style Smart 3d Chart:
-
smart-3d-chart - applied to the whole 3D Chart element.
-
.smart-container - applied to the container that holds all internal elements of the 3D Chart.
- .smart-3d-chart-controls - applied to the 3D Chart's controls toolbar.
- smart-3d-chart-control - applied to individual controls in the toolbar.
- smart-3d-chart-control-tooltip - applied to each control tooltip in the toolbar
- .smart-3d-chart-caption - applied to the 3D Chart's description.
- .smart-3d-chart-legend - applied to the 3D Chart's legend.
- .smart-3d-chart-legend-item - applied to each legend item.
- smart-3d-chart-legend-item-text - applied to the text of each legend item.
- smart-3d-chart-legend-item-color - applied to the color box of each legend item.
- .smart-3d-chart-legend-item - applied to each legend item.
- .smart-3d-chart-axis-label - applied to the value axis labels.
- .smart-3d-chart-axis-label-x - applied to the labels on the x-axis.
- .smart-3d-chart-axis-label-z - applied to the labels on the z-axis.
- .smart-3d-chart-range-selector - applied to the 3D Chart's range selector.
- .smart-3d-chart-legend-table - applied to the 3D Chart's legend table.
- .smart-3d-chart-controls - applied to the 3D Chart's controls toolbar.
-
.smart-3d-chart-tooltip - applied to the 3D Chart's tooltip.
- .smart-3d-chart-tooltip-heading - applied to the tooltip's header.
- .smart-3d-chart-tooltip-body - applied to the tooltip's body.
-
.smart-container - applied to the container that holds all internal elements of the 3D Chart.
Live Example
The following live example demonstrates many of the functionalities described in this tutorial:
<!DOCTYPE html>
<html xmlns="http://www.w3.org/1999/xhtml">
<head>
    <title>Custom Styling Example</title>
    <link rel="stylesheet" type="text/css" href="../../../source/styles/smart.default.css" />
    <style type="text/css">
        #3d-chart .smart-3d-chart-axis-text,
        #3d-chart .smart-3d-chart-legend-text {
            fill: #FFFFFF;
            text-shadow: 3px 3px 0 #000, -1px -1px 0 #000, 1px -1px 0 #000, -1px 1px 0 #000, 1px 1px 0 #000;
        }

        .smart-3d-chart-tooltip-text {
            color: #000000;
        }

        .smart-3d-chart-tooltip-content {
            border-width: 2px;
            background: repeating-linear-gradient( 45deg, transparent, transparent 10px, #ccc 10px, #ccc 20px ), linear-gradient( to bottom, #eee, #999 );
        }
    </style>
    <script type="text/javascript" src="https://cdnjs.cloudflare.com/ajax/libs/webcomponentsjs/2.2.7/webcomponents-bundle.js"></script>
    <script type="text/javascript" src="../../../source/smart.element.js"></script>
    <script type="text/javascript" src="../../../source/smart.elements.js"></script>
    <script>
    let sampleData = [];
    let startingDate = new Date("2020-05-21");
    for(let i=0; i<50; i++){
      startingDate.setDate(startingDate.getDate() + 1);
      let fomrattedDate =  startingDate.getDate()+"/"+(startingDate.getMonth()+1);
      let high = Math.floor(Math.random() * 100) + 500;
      do{
        var low = Math.floor(Math.random() * 100) + 400
      }while(low >= high);
      do{
        var openPrice = Math.floor(Math.random() * 100) + 400;
      }while(openPrice > high || openPrice < low);
      do{
        var closePrice = Math.floor(Math.random() * 100) + 400;
      }while(closePrice > high || closePrice < low);

      sampleData.push({
        Date: fomrattedDate,
        SPClose: closePrice,
        SPOpen: openPrice,
        SPHigh: high,
        SPLow: low,
        DOW: Math.floor(Math.random() * 200) + 100,
      })
    }

    Smart(
      "#chart",
      class {
        get properties() {
          return {
            autoRotate: false,
            caption: "Stock Prices Changes",
            description: "",
            backgroundColor: "white",
            showLegend: false,
            cameraPosition: {
              x: 0,
              y: 10,
              z: 55,
            },
            cameraZoom: 1,
            cameraAnimationSpeed: 2,
            dataSource: sampleData,
            colorScheme: "scheme29",
            xAxis: {
              dataField: "Date",
              gridLines: {
                visible: true,
              },
            },
            gridOptions:{
              slotWidthZ: 5
            },
            valueAxis: {
              unitInterval: 100,
              minValue: 0,
            },
            width: 800,
            height: 500,
            seriesGroups: [
              {
                type: "column",
                series: [
                  {
                    dataField: "DOW",
                    displayText: "DOW Jones",
                  }
                ],
                colorFunction: function (value, itemIndex, serie, group) {
                  return (value < 200) ? '#E25848' : '#61D14F';
                }
              },
              {
                type: "ohlc",

                series: [
                  {
                    dataFieldClose: 'SPClose',
                    displayTextClose: 'Close price',
                    dataFieldOpen: 'SPOpen',
                    displayTextOpen: 'Open price',
                    dataFieldHigh: 'SPHigh',
                    displayTextHigh: 'High price',
                    dataFieldLow: 'SPLow',
                    displayTextLow: 'Low price',
                    displayText: 'S&P 500',
                }
                ],
                colorFunction: function (value, itemIndex, serie, group) {
                  return (value.close > value.open) ? '#E25848' : '#61D14F';
                }
              }
            ],
          };
        }
      }
    );
    </script>
</head>
<body>
    <smart-3d-chart id="chart"></smart-3d-chart>
</body>
</html>