Chart Formatting
Build your web apps using Smart UI
Smart.Chart - formatting configuration and usage
Chart Formatting
Smart.Chart allows you to format text in two different ways. The first approach is to use the formatSettings property which is available for each series group, series, and axis. The series and series group settings affect the formatting of labels and tooltips. The axis format settings affect the formatting of the labels displayed along the axis.
The formatSettings property provides the following options:
- decimalSeparator - character used as a decimal separator. If not specified, the default separator is '.'
- thousandsSeparator - character used as thousands separator. Default value is ','
- decimalPlaces - number of digits after the decimal separator. Default value is 2 for floating point numbers.
- negativeWithBrackets - boolean which specifies whether to display negative numbers in brackets. Default value is false.
- prefix - any string which will be added as a prefix. Default value is empty.
- sufix - any string which will be added as a sufix. Default value is empty.
- dateFormat - optional date format string. This property is applicable only when displaying Date objects.
All fields in the formatSettings object are optional. Here is a basic example of its use:
valueAxis:
{
    labels: {
        formatSettings: {
            prefix: '$',
            thousandsSeparator: ','
        }
    }
}
The second approach, using formatFunction, is more powerful. It allows you to use a custom text formatting callback function written in JavaScript. The function is required to accept at least one parameter which is the value that will be formatted. Smart.Chart will call the function every time it needs to format and display a value. You can specify a custom format function for each series group, serie or axis. The following example is a simple format function which returns the month for a given date value:
xAxis:
{
    labels: {
        formatFunction: function (value) {
            const days = ['Monday', 'Tuesday', 'Wednesday', 'Thursday', 'Friday', 'Saturday', 'Sunday'];
            return days[value];
        }
    }
}
Please note that if formatFunction is implemented for a particular chart part, formatSettings has no effect.
Tooltip Formatting
In order to format the tooltips, you can use toolTipFormatSettings and toolTipFormatFunction which work the same way as formatSettings and formatFunction. The callback toolTipFormatFunction accepts several parameters, the first of which is the value that will be formatted and returns a string.
toolTipFormatFunction: function (value, itemIndex, series, group, xAxisValue, xAxis) {
    const monthFormatter = new Intl.DateTimeFormat('en', { month: 'short' });
    return value.getDate() + '-' + monthFormatter.format(value) + '-' + value.getFullYear();
}
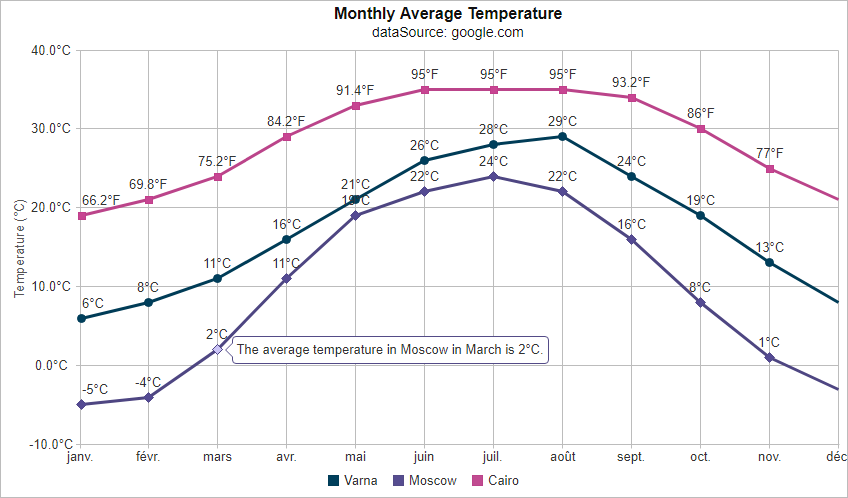
Example
The following code example features several parts of the chart being formatted using the aforementioned methods. The resulting Smart.Chart is shown in an image at the bottom.
<!DOCTYPE html>
<html xmlns="http://www.w3.org/1999/xhtml">
<head>
    <title>Chart Formatting Example</title>
    <link rel="stylesheet" type="text/css" href="../../source/styles/smart.default.css" />
    <script type="text/javascript" src="https://cdnjs.cloudflare.com/ajax/libs/webcomponentsjs/2.2.7/webcomponents-bundle.js"></script>
    <script type="text/javascript" src="../../source/smart.elements.js"></script>
    <script type="text/javascript">
        const sampleData = [
            { Month: 0, Varna: 6, Moscow: -5, Cairo: 19 },
            { Month: 1, Varna: 8, Moscow: -4, Cairo: 21 },
            { Month: 2, Varna: 11, Moscow: 2, Cairo: 24 },
            { Month: 3, Varna: 16, Moscow: 11, Cairo: 29 },
            { Month: 4, Varna: 21, Moscow: 19, Cairo: 33 },
            { Month: 5, Varna: 26, Moscow: 22, Cairo: 35 },
            { Month: 6, Varna: 28, Moscow: 24, Cairo: 35 },
            { Month: 7, Varna: 29, Moscow: 22, Cairo: 35 },
            { Month: 8, Varna: 24, Moscow: 16, Cairo: 34 },
            { Month: 9, Varna: 19, Moscow: 8, Cairo: 30 },
            { Month: 10, Varna: 13, Moscow: 1, Cairo: 25 },
            { Month: 11, Varna: 8, Moscow: -3, Cairo: 21 }
        ];

        Smart('#chart', class {
            get properties() {
                return {
                    caption: 'Monthly Average Temperature',
                    description: 'dataSource: google.com',
                    showLegend: true,
                    padding: { left: 10, top: 5, right: 10, bottom: 5 },
                    titlePadding: { left: 50, top: 0, right: 0, bottom: 10 },
                    dataSource: sampleData,
                    colorScheme: 'scheme29',
                    xAxis:
                    {
                        dataField: 'Month',
                        tickMarks: {
                            visible: true,
                            interval: 1,
                            color: '#BCBCBC'
                        },
                        gridLines: {
                            visible: true,
                            interval: 3,
                            color: '#BCBCBC'
                        },
                        labels: {
                            formatFunction: function (value) {
                                const monthFormatter = new Intl.DateTimeFormat('fr', { month: 'short' }),
                                    date = new Date();

                                date.setMonth(value);
                                return monthFormatter.format(date);
                            }
                        }
                    },
                    valueAxis:
                    {
                        visible: true,
                        title: { text: 'Temperature (°C)' },
                        tickMarks: { color: '#BCBCBC' },
                        unitInterval: 10,
                        minValue: -10,
                        maxValue: 40,
                        formatSettings: {
                            sufix: '°C', decimalPlaces: 1
                        }
                    },
                    toolTipFormatFunction: function (value, itemIndex, series, group, xAxisValue, xAxis) {
                        const monthFormatter = new Intl.DateTimeFormat('en', { month: 'long' }),
                            date = new Date();

                        date.setMonth(value);

                        return `The average temperature in ${series.displayText} in ${monthFormatter.format(date)} is ${value}°C.`;
                    },
                    seriesGroups:
                        [
                            {
                                type: 'line',
                                formatSettings: {
                                    sufix: '°C', decimalPlaces: 0
                                },
                                series: [
                                    { dataField: 'Varna', displayText: 'Varna', labels: { visible: true }, symbolType: 'circle', symbolSize: 8 },
                                    { dataField: 'Moscow', displayText: 'Moscow', labels: { visible: true }, symbolType: 'diamond', symbolSize: 10 },
                                    {
                                        dataField: 'Cairo',
                                        displayText: 'Cairo',
                                        labels: {
                                            visible: true,
                                            formatFunction: function (value, itemIndex, series, group) {
                                                return (value * 9 / 5) + 32 + '°F';
                                            }
                                        },
                                        symbolType: 'square',
                                        symbolSize: 8
                                    }
                                ]
                            }
                        ]
                }
            }
        });
    </script>
</head>
<body>
    <smart-chart id="chart"></smart-chart>
</body>
</html>
For AI tooling
Developer Quick Reference
Topic: chart-formatting Component: Chart Framework: JavaScript
Main methods: (none detected)
Common config keys: dataSource
Implementation Notes
Compatibility: Modern browsers / Web Components API access pattern: const component = document.querySelector(...) + component.method()
Lifecycle guidance: Initialize configuration first, then invoke imperative API when element is available in DOM.
Common pitfalls:
- Calling methods before element initialization.
- Reassigning large configuration partially without understanding merge behavior.
- Missing required module script import for component type.
Validation checklist:
- Ensure module scripts and CSS are loaded once.
- Keep data schema aligned with columns/series definitions.
- Verify method calls target initialized component instance.