Blazor - Get Started with Smart.Chart
Setup The Project
Follow the Getting Started guide to set up your Blazor Application with Smart UI.
Smart.Chart is a lightweight and powerful chart custom element. It offers many advanced features and supports two different rendering technologies - SVG and HTML5 Canvas - and over 30 chart types. You can use Smart.Chart to add interactive charts to your website, build custom dashboards, or use it in your mobile applications. Smart.Chart offers excellent cross-browser compatibility and works well with both desktop and mobile browsers.
Chart Basic Concepts
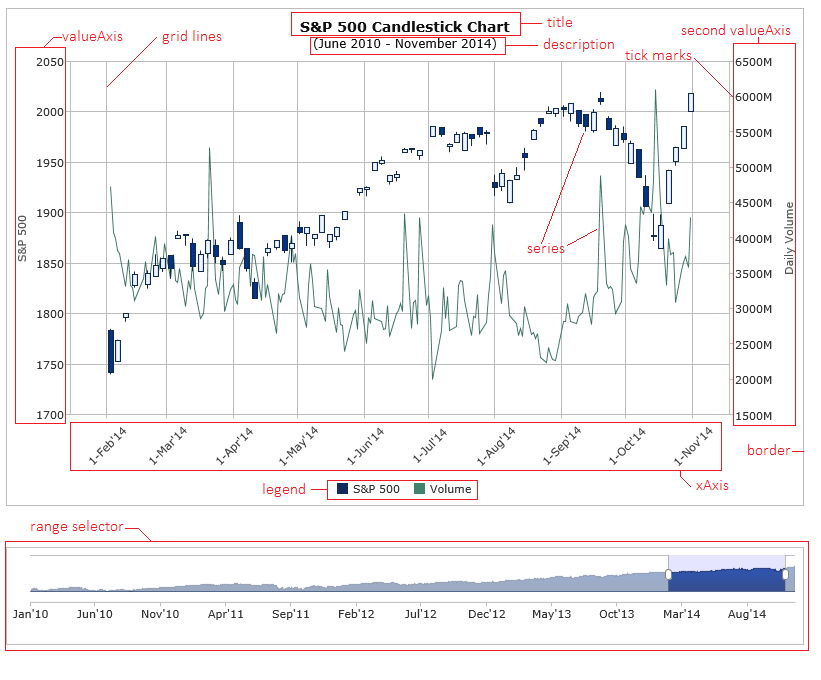
Before you start using Smart.Chart, you need to learn how it works and some basic concepts. Depending on which features you use, your chart may contain the following elements:
- horizontal axis (XAxis)
- vertical axis (ValueAxis)
- caption & description
- one or more series groups and series
- grid lines & tick marks
- legend
- border line
- background
- tooltips
- annotations
- range selector
The following image illustrates the different elements in Smart.Chart:
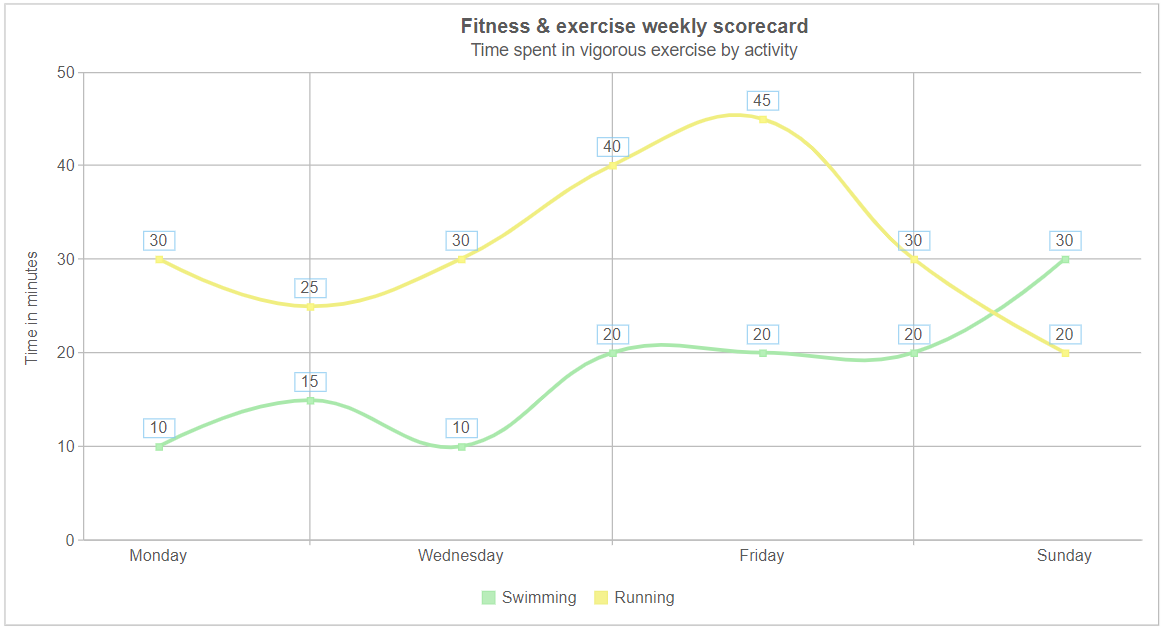
Setup Chart
Below is an example of how to setup the Chart. The code specifies the Caption and Description that the chart will display and sets the DataSource property. In this example, we bind the (horizontal) XAxis to the Day property of our data source. The chart will display the data in two series of type "Spline". Each of the series is bound to another property in our data source.
You can read more about the different series types in the Blazor Chart Types guide.
<Chart DataSource="sampleData" Caption="Fitness & exercise weekly scorecard" Description="Time spent in vigorous exercise by activity"
        ShowLegend Padding="new Padding() { Left = 10, Top = 10, Right = 15, Bottom = 10 }" ColorScheme="ChartColorScheme.Scheme13"
        TitlePadding="new Padding() { Left = 90, Top = 0, Right = 0, Bottom = 10 }" XAxis="xAxis" ValueAxis="valueAxis" SeriesGroups="seriesGroups" />

@code {

    List<Dictionary<string, object>> sampleData = new List<Dictionary<string, object>>()
    {
        new Dictionary<string, object> { { "Day", "Monday" }, { "Running", 30 }, { "Swimming", 10 }, { "Cycling", 25 } },
        new Dictionary<string, object> { { "Day", "Tuesday" }, { "Running", 25 }, { "Swimming", 15 }, { "Cycling", 10 } },
        new Dictionary<string, object> { { "Day", "Wednesday" }, { "Running", 30 }, { "Swimming", 10 }, { "Cycling", 25 } },
        new Dictionary<string, object> { { "Day", "Thursday" }, { "Running", 40 }, { "Swimming", 20 }, { "Cycling", 25 } },
        new Dictionary<string, object> { { "Day", "Friday" }, { "Running", 45 }, { "Swimming", 20 }, { "Cycling", 25 } },
        new Dictionary<string, object> { { "Day", "Saturday" }, { "Running", 30 }, { "Swimming", 20 }, { "Cycling", 30 } },
        new Dictionary<string, object> { { "Day", "Sunday" }, { "Running", 20 }, { "Swimming", 30 }, { "Cycling", 10 } }
    };

    ChartXAxis xAxis = new ChartXAxis()
    {
        DataField = "Day",
        UnitInterval = 2,
        TickMarks = new ChartLines()
        {
            Visible = true,
            UnitInterval = 1
        },
        GridLines = new ChartLines()
        {
            Visible = true,
            UnitInterval = 1
        },
        ValuesOnTicks = false,
        Padding = new Padding() { Bottom = 10 }
    };

    ChartValueAxis valueAxis = new ChartValueAxis()
    {
        UnitInterval = 10,
        MinValue = 0,
        MaxValue = 50,
        Title = new ChartTitle() { Text = "Time in minutes<br><br>" },
        Labels = new ChartLabels()
        {
            HorizontalAlignment = HorizontalAlignment.Right
        }
    };

    List<ChartSeriesGroup> seriesGroups = new List<ChartSeriesGroup>()
    {
        new ChartSeriesGroup()
        {
            Type = ChartType.Spline,
            Series = new List<ChartSeriesGroupSerie>()
            {
                new ChartSeriesGroupSerie()
                {
                    DataField = "Swimming",
                    SymbolType = ChartSymbolType.Square,
                    Labels = new ChartLabels()
                    {
                        Visible = true,
                        BackgroundColor = "#FEFEFE",
                        BackgroundOpacity = 0.2f,
                        BorderColor = "#7FC4EF",
                        BorderOpacity = 0.7f,
                        Padding = new Padding() { Left = 5, Right = 5, Top = 0, Bottom = 0 }
                    }
                },
                new ChartSeriesGroupSerie()
                {
                    DataField = "Running",
                    SymbolType = ChartSymbolType.Square,
                    Labels = new ChartLabels()
                    {
                        Visible = true,
                        BackgroundColor = "#FEFEFE",
                        BackgroundOpacity = 0.2f,
                        BorderColor = "#7FC4EF",
                        BorderOpacity = 0.7f,
                        Padding = new Padding() { Left = 5, Right = 5, Top = 0, Bottom = 0 }
                    }
                }
            }
        }
    };
}
Result: