Chart Axes
Build your web apps using Smart UI
Smart.Chart - Axes configuration and usage
Chart Axis Properties and Settings
Smart.Chart has two main types of axes - valueAxis and xAxis. Typically the valueAxis represents the vertical axis in the chart although you may choose to rotate the axes and in this case the valueAxis will be displayed horizontally.
The following image illustrates the different elements of the axes:
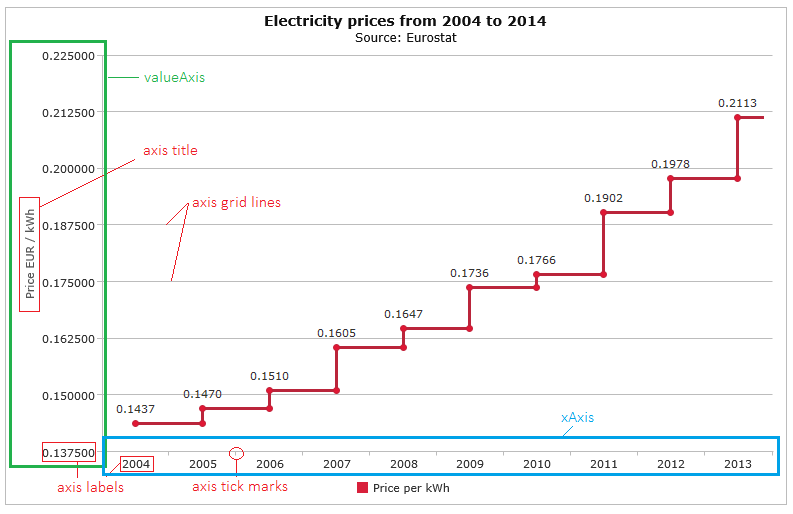
The labels displayed along the valueAxis are derived from the values of the series displayed in the chart. The labels along the xAxis are derived from the values of the xAxis.dataField property in your data source. In case you don't specify a dataField property, the xAxis will show sequential numbers corresponding to each record in the data source.
Common Axis Properties
Both the valueAxis and the xAxis have a set of common properties and settings. Most of the properties are optional and if you don't change them, Smart.Chart will use default settings.
Here is a list of the common properties that you may change:
- visible - a boolean determining whether the axis is visible.
- minValue - sets the minimum value of the axis. If not set, the chart will use the minimum value from the data source.
- maxValue - sets the maximum value of the axis. If not set, the chart will use the maximum value from the data source.
- unitInterval - an integer value which determines the interval between the values along the axis. If not set, the chart will automatically calculate the size of the interval. The algorithm will try to ensure that all labels, grid lines and tick marks fit well depending on the size of the axis and the total number of data points.
- axisSize - an integer which determines the size of the axis. This property is optional as the chart can automatically calculate the required size.
- flip - specifies whether the values are displayed in reverse order.
-
position - determines the position of the axis.
- left - the axis will be displayed on the left side of the chart. This is applicable to valueAxis (or xAxis in case of axis rotation).
- right - the axis will be displayed on the right side of the chart. This is applicable to valueAxis (or xAxis in case of axis rotation).
- top - the axis will be displayed at the top of the chart. This is applicable to xAxis (or valueAxis in case of axis rotation).
- bottom - the axis will be displayed at the bottom of the chart. This is applicable to xAxis (or valueAxis in case of axis rotation).
-
padding - determines the left, right, top and bottom padding of the axis.
- left - integer representing left padding of the axis. It's applicable to vertical axes.
- right - integer representing right padding of the axis. It's applicable to vertical axes.
- top - integer representing top padding of the axis. It's applicable to horizontal axes.
- bottom - integer representing bottom padding of the axis. It's applicable to horizontal axes.
-
title - a collection of properties describing how to display the title of the axis.
- visible - a boolean determining whether the title is visible.
- text - a string representing the text of the axis title.
- class - a string representing the CSS class of the axis title.
- horizontalAlignment - horizontal alignment of the axis title. Valid values are 'left', 'center', 'right'.
- verticalAlignment - vertical alignment of the axis title. Valid values are 'top', 'center', 'bottom'.
-
labels - a collection of properties describing how to display the labels along the axis.
- visible - a boolean determining whether the labels is visible.
- step - an integer value which determines the labels' intervals step.
- class - a string representing the CSS class of the axis labels.
-
formatSettings - settings used to format the labels.
- prefix - a string that will appear at the begining of the text.
- sufix - a string that will appear at the end of the text.
- decimalSeparator - a symbol used to mark the border between the integer and fractional part of a number.
- thousandsSeparator - a symbol used to mark the border between thousands, millions, billions, etc.
- decimalPlaces - the number of digits displayed after the decimal separator.
- negativeWithBrackets - a boolean value indicating whether to display negative numbers in brackets.
- formatFunction - callback function used to format the labels.
- angle - an integer representing the labels rotation angle in degrees.
- rotationPoint - position to rotate the text around, e.g. 'lefttop', 'leftcenter', 'leftbottom', 'centertop', etc.
- horizontalAlignment - horizontal alignment of the axis labels. Valid values are 'left', 'center', 'right'.
- verticalAlignment - vertical alignment of the axis labels. Valid values are 'top', 'center', 'bottom'.
- offset - custom horizontal and vertical labels position offset, e.g. {x: 5, y: 2}
- autoRotate - a boolean which determines whether to enable automatic labels rotation. This property is applicable to pie, donut, polar and spider charts.
-
gridLines - a collection of properties describing how to display the axis grid lines.
- visible - a boolean determining whether the grid lines are visible.
- step - an integer value which determines the the grid lines' interval step.
- color - a string representing color of the grid lines.
- lineWidth - an integer representing the line width of the grid lines. The default value is 1.
- dashStyle - a string sequence of numbers represening line and space lengths, e.g. '2,2'.
-
tickMarks- a collection of properties describing how to display the axis tick marks lines
- visible - a boolean determining whether the tick marks are visible.
- step - an integer value which determines the tick marks' interval step.
- color - a string representing color of the tick marks lines.
- size - an integer representing the size of the tick marks. The default value is 4.
- lineWidth - an integer representing the line width of the tick marks. The default value is 1.
- dashStyle - a string sequence of numbers represening line and space lengths, e.g. '2,2'.
-
line - a collection of properties describing line of the axis
- visible - a boolean determining whether the axis line is visible.
- color - a string representing color of the axis line.
- lineWidth - an integer representing the width of the axis line. The default value is 1.
- dashStyle - a string sequence of numbers represening line and space lengths, e.g. '2,2'.
- alternatingBackgroundColor - alternating background color between grid lines.
- alternatingBackgroundColor2 - second alternating background color.
- alternatingBackgroundOpacity - opacity of the alternating background.
xAxis-specific Properties
There are several properties which are applicable only to the xAxis:
-
type - the type of the xAxis. Values can be:
- 'auto' - automatically detects and switches to 'basic', 'linear' or 'date'
- 'date'- when displaying dates
- 'basic' - displays all data points sequencially
- 'linear' - linear arrangement by the value of the category axis data field
- baseUnit - the base unit when used with 'date' axis. Values can be 'year', 'month', 'day', 'hour', 'minute', 'second' or 'millisecond'.
- valuesOnTicks - specifies whether the axis values will be aligned with the tick marks.
- dataField - name of the field in the data source. The values of this field will be displayed along the axis.
- rangeSelector - definition of a range selector on the xAxis. For more details, please check the xAxis.rangeSelector entry in the API documentation and the Zooming (Range Selection) demos.
valueAxis-specific Properties
Similarly, several properties are applicable only to the valueAxis:
- baselineValue - an integer representing the baseline value for the axis. The default value is 0.
- logarithmicScale - a boolean representing whether to use logarithmic scale. The default value is false.
- logarithmicScaleBase - an integer representing the base of logarithmic scale. The default value is 10.
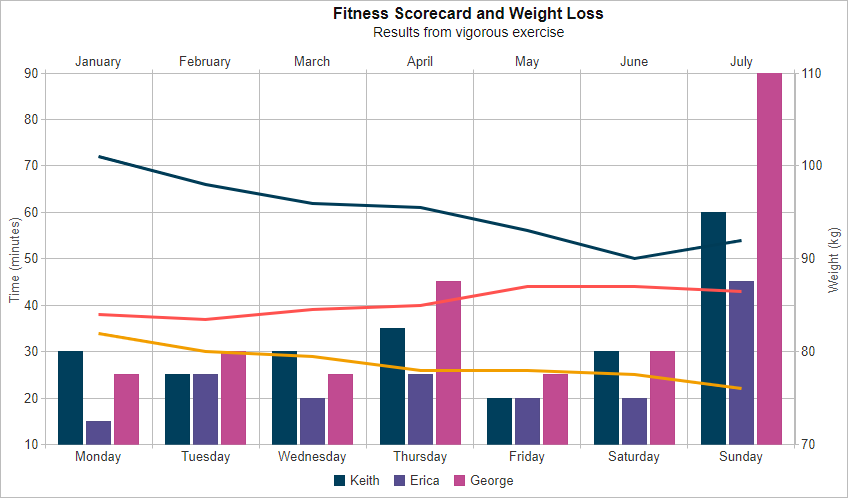
Multiple Horizontal and/or Vertical axes
Multiple xAxis and valueAxis instances can be plotted on the same Chart by adding multiple series groups with their own xAxis and valueAxis settings, as shown in the following example:
<!DOCTYPE html>
<html xmlns="http://www.w3.org/1999/xhtml">
<head>
    <title>Multiple Axes Example</title>
    <link rel="stylesheet" type="text/css" href="../../source/styles/smart.default.css" />
    <script type="text/javascript" src="https://cdnjs.cloudflare.com/ajax/libs/webcomponentsjs/1.2.0/webcomponents-lite.js"></script>
    <script type="text/javascript" src="../../source/smart.elements.js"></script>
    <script type="text/javascript">
        const fitnessTime = [
            { Day: 'Monday', Keith: 30, Erica: 15, George: 25 },
            { Day: 'Tuesday', Keith: 25, Erica: 25, George: 30 },
            { Day: 'Wednesday', Keith: 30, Erica: 20, George: 25 },
            { Day: 'Thursday', Keith: 35, Erica: 25, George: 45 },
            { Day: 'Friday', Keith: 20, Erica: 20, George: 25 },
            { Day: 'Saturday', Keith: 30, Erica: 20, George: 30 },
            { Day: 'Sunday', Keith: 60, Erica: 45, George: 90 }
        ],
            weight = [
                { Month: 'January', Keith: 84, Erica: 82, George: 101 },
                { Month: 'February', Keith: 83.5, Erica: 80, George: 98 },
                { Month: 'March', Keith: 84.5, Erica: 79.5, George: 96 },
                { Month: 'April', Keith: 85, Erica: 78, George: 95.5 },
                { Month: 'May', Keith: 87, Erica: 78, George: 93 },
                { Month: 'June', Keith: 87, Erica: 77.5, George: 90 },
                { Month: 'July', Keith: 86.5, Erica: 76, George: 92 }
            ];

        Smart('#chart', class {
            get properties() {
                return {
                    caption: 'Fitness Scorecard and Weight Loss',
                    description: 'Results from vigorous exercise',
                    showLegend: true,
                    padding: { left: 5, top: 5, right: 5, bottom: 5 },
                    titlePadding: { left: 90, top: 0, right: 0, bottom: 10 },
                    colorScheme: 'scheme29',
                    seriesGroups:
                        [
                            {
                                dataSource: fitnessTime,
                                type: 'column',
                                xAxis:
                                {
                                    dataField: 'Day',
                                },
                                valueAxis:
                                {
                                    unitInterval: 10,
                                    displayValueAxis: true,
                                    description: 'Time (minutes)'
                                },
                                series: [
                                    { dataField: 'Keith' },
                                    { dataField: 'Erica' },
                                    { dataField: 'George' }
                                ]
                            },
                            {
                                showLegend: false,
                                dataSource: weight,
                                type: 'line',
                                xAxis:
                                {
                                    dataField: 'Month',
                                    position: 'top'
                                },
                                valueAxis:
                                {
                                    position: 'right',
                                    unitInterval: 10,
                                    displayValueAxis: true,
                                    description: 'Weight (kg)'
                                },
                                series: [
                                    { dataField: 'Keith' },
                                    { dataField: 'Erica' },
                                    { dataField: 'George' }
                                ]
                            }
                        ]
                }
            }
        });
    </script>
</head>
<body>
    <smart-chart id="chart"></smart-chart>
</body>
</html>
For AI tooling
Developer Quick Reference
Topic: chart-axes Component: Chart Framework: JavaScript
Main methods: (none detected)
Common config keys: dataSource
Implementation Notes
Compatibility: Modern browsers / Web Components API access pattern: const component = document.querySelector(...) + component.method()
Lifecycle guidance: Initialize configuration first, then invoke imperative API when element is available in DOM.
Common pitfalls:
- Calling methods before element initialization.
- Reassigning large configuration partially without understanding merge behavior.
- Missing required module script import for component type.
Validation checklist:
- Ensure module scripts and CSS are loaded once.
- Keep data schema aligned with columns/series definitions.
- Verify method calls target initialized component instance.