Debug Smart UI for Angular
The Angular CLI is a command-line tool for scaffolding and building Angular applications.
1. Installation
The easiest way to get started with Smart UI for Angular is to use the Angular CLI Tool. To scaffold your project structure, follow its installation instructions.npm install -g @angular/cli ng new smart-project cd smart-project ng add smart-webcomponents-angular
2. Import the NgModule of the components you need in src/app/app.module.ts.
app.module.ts
import { NgModule } from '@angular/core';
import { BrowserModule } from '@angular/platform-browser';

import { AccordionModule } from 'smart-webcomponents-angular/accordion';

import { AppComponent } from './app.component';

@NgModule({
    declarations: [ AppComponent ],
    imports: [ BrowserModule, AccordionModule ],
    bootstrap: [ AppComponent ]
})

export class AppModule { }
3. Edit the template in src/app/app.component.html
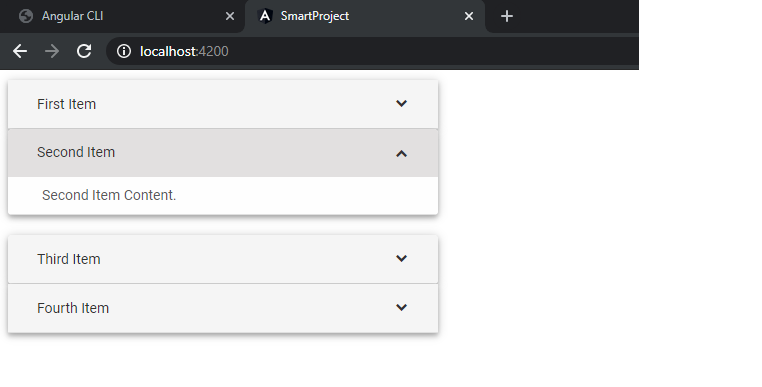
app.component.html<smart-accordion #accordion> <smart-accordion-item [label]="'First Item'">First Item Content.</smart-accordion-item> <smart-accordion-item [label]="'Second Item'">Second Item Content.</smart-accordion-item> <smart-accordion-item [label]="'Third Item'">Third Item Content.</smart-accordion-item> <smart-accordion-item [label]="'Fourth Item'">Fourth Item Content.</smart-accordion-item> </smart-accordion>
4. Edit the src/app/app.component.ts
app.component.ts
import { Component, ViewChild } from '@angular/core';
import { AccordionComponent, AccordionItemComponent, AccordionExpandMode } from 'smart-webcomponents-angular/accordion';

@Component({
    selector: 'app-root',
    templateUrl: './app.component.html'
})

export class AppComponent {
    @ViewChild('accordion', { read: AccordionComponent, static: false }) accordion!: AccordionComponent;

    ngOnInit(): void {

    }
    ngAfterViewInit(): void {
		const that = this;
		that.accordion.expandMode = AccordionExpandMode.Multiple;
		that.accordion.expand(1);
    }
}
5. Debug with Chrome DevTools
- Run the following command: ng serve
- Open localhost:4200 with Google Chrome
- Open Chrome DevTools by pressing F12
- Open the sources tab
- To debug the app.component.ts, app.module.ts and app.component.html, navigate to "webpack://", then "./src/app/app.component.ts"

- To debug the Smart's Angular Component, navigate to "webpack://", then "./src/./node_modules/smart-webcomponents-angular/__ivy_ngcc/fesm2015/smart-webcomponents-angular-accordion.js"

6. Debug with Visual Studio Code
The Visual Studio Code editor supports Angular IntelliSense and code navigation out of the box.- Open VSCode
- Open the project's folder.
- In our case, this is "C:\smart\smart-project".
- To debug the client side Angular code, we'll need to install the "Debugger for Chrome" extension.
Open the Extensions view (Ctrl+Shift+X) and type 'chrome' in the search box. You'll see several extensions which reference Chrome.

- Set a breakpoint
To set a breakpoint in app.component.ts, click on the gutter to the left of the line numbers. This will set a breakpoint which will be visible as a red circle.
Syntax highlighting and bracket matching
You'll notice that VS Code has syntax highlighting for the various source code elements and, if you put the cursor on a parenthesis, the matching bracket is also selected.IntelliSense
As you hover your mouse over text in the file, you'll see that VS Code gives you information about key items in your source code. Items such as variables, classes and Angular decorators are a few examples where you'll be presented with this information When you start typing in app.component.ts, you'll see smart suggestions and code snippets.
- Configure the Chrome debugger
- Open Terminal and type ngserve

- Press F5 to start debugging.
- Now, you can Debug with VSCode your Angular application with Smart Components.
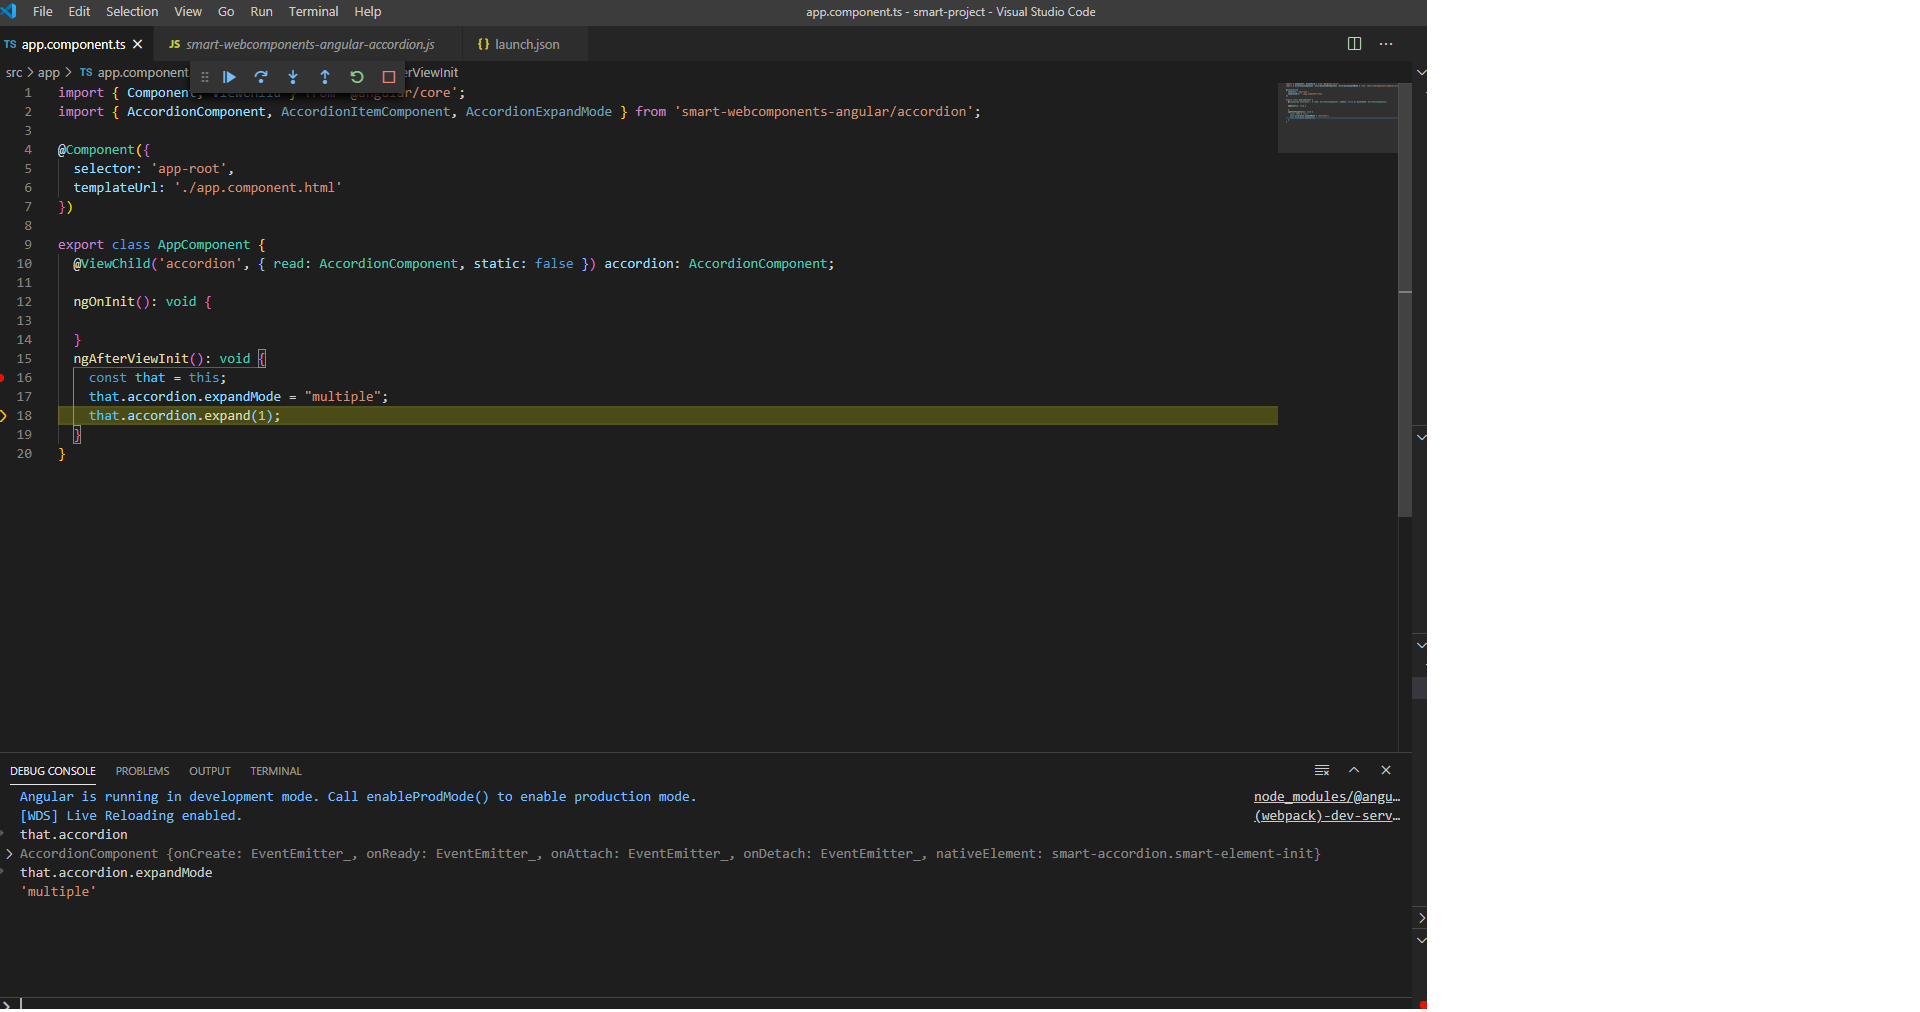 You can step through your source code (F10), inspect variables such as AppComponent, and see the call stack of the client side Angular application.
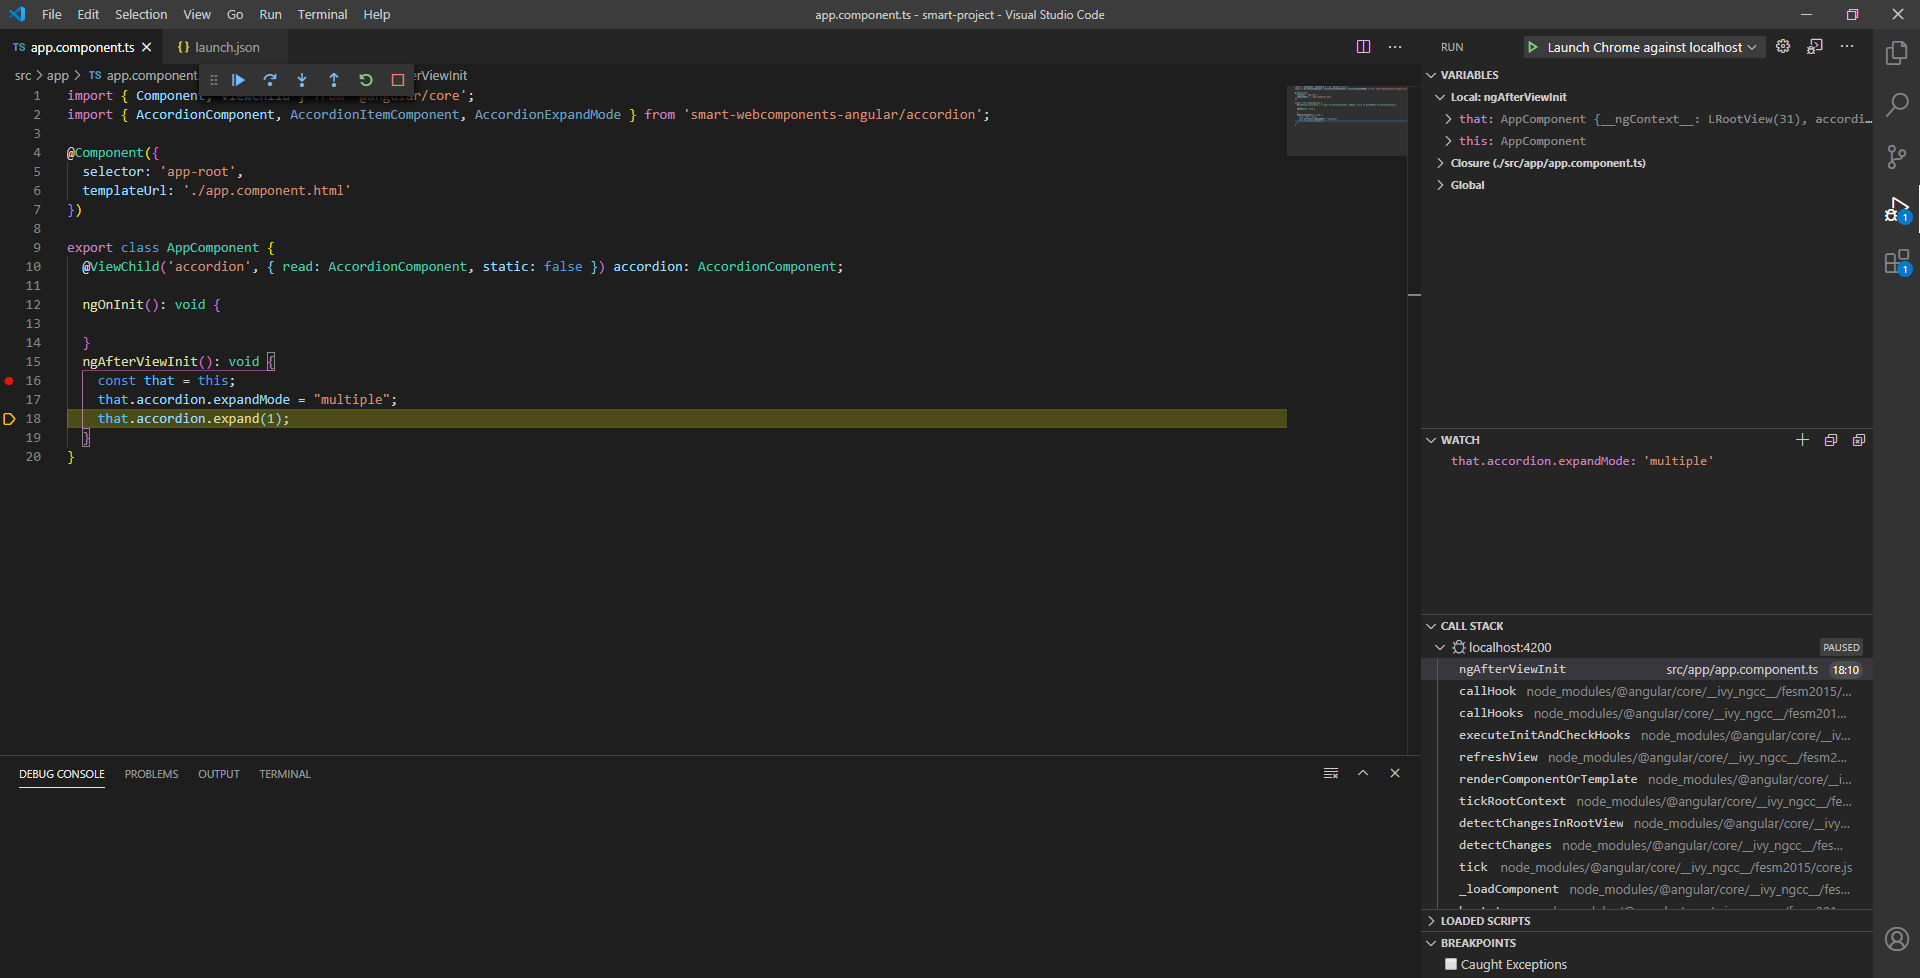
You can also Step into source code (F11) in order to debug Smart UI Components.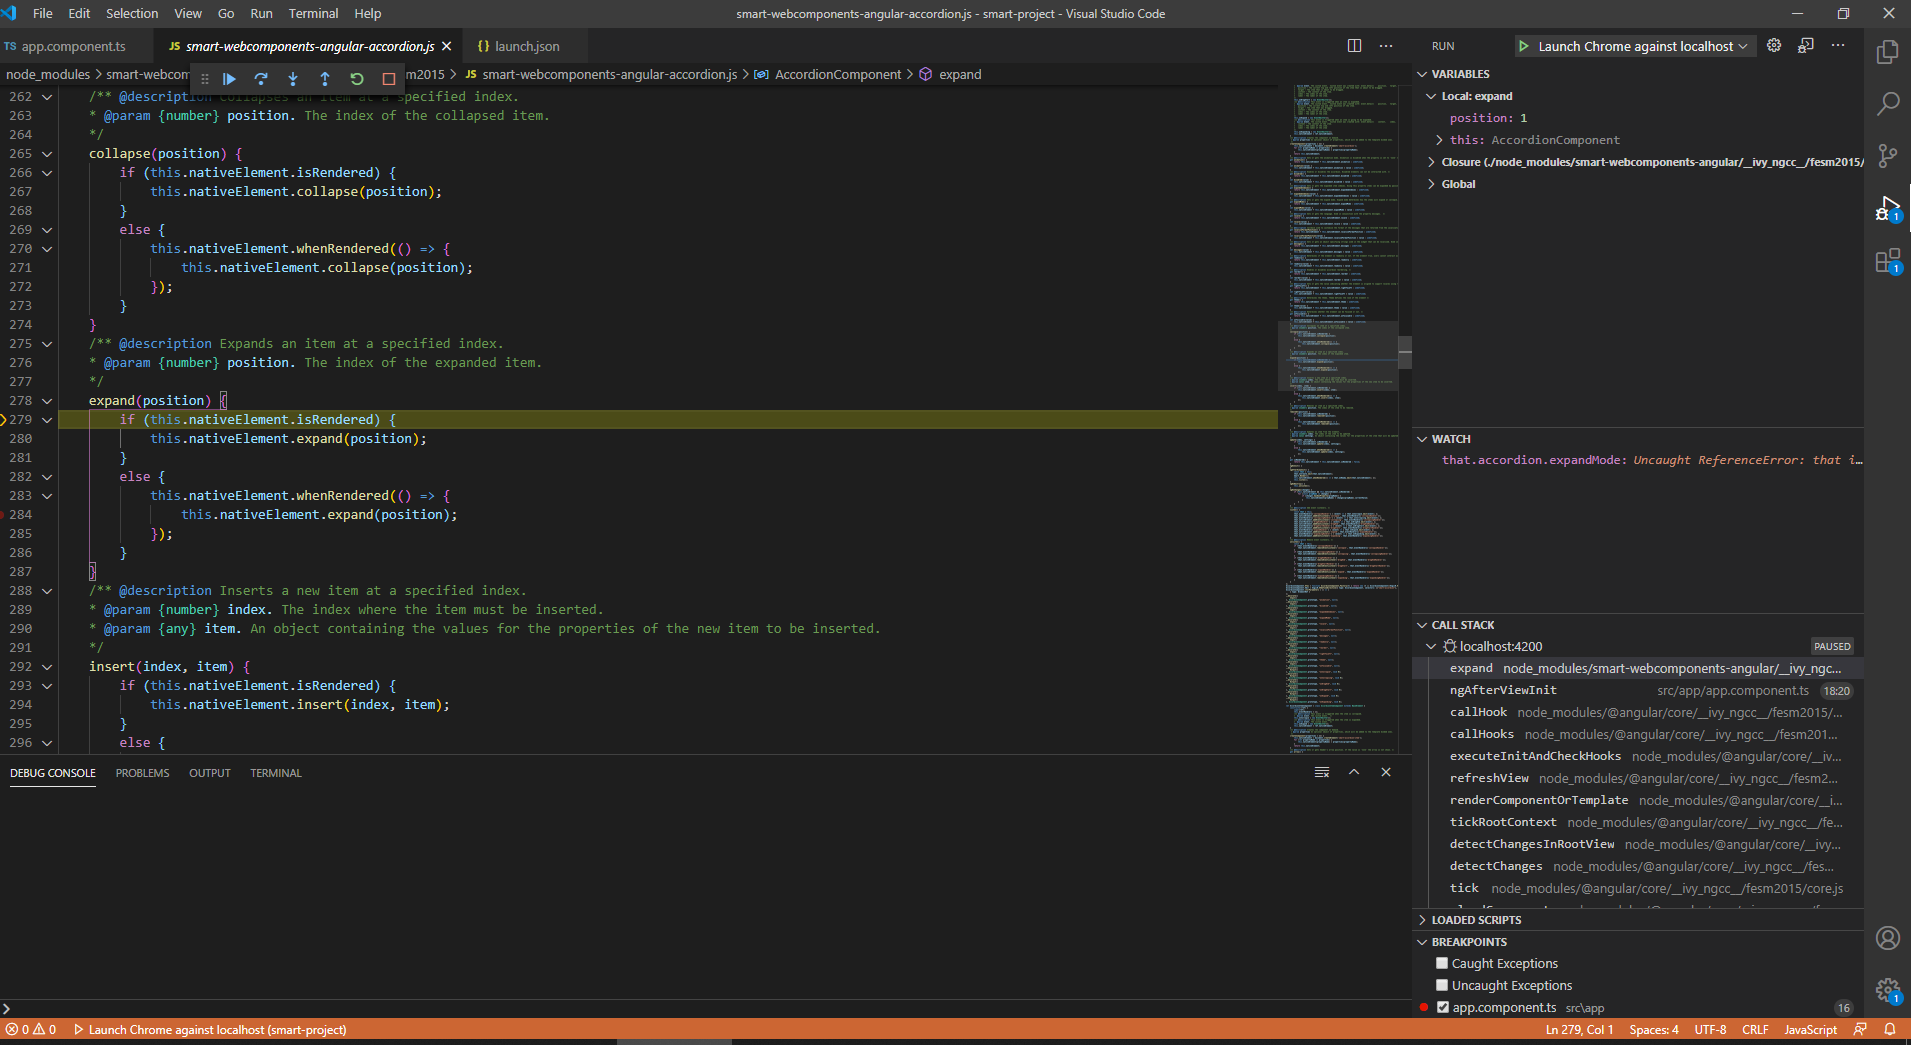
We need to initially configure the debugger. To do so, go to the Run view (Ctrl+Shift+D) and click on the gear button to create a launch.json debugger configuration file. Choose Chrome from the Select Environment drop-down list. This will create a launch.json file in a new .vscode folder in your project which includes a configuration to launch the website.
We need to make one change for our example: change the port of the url from 8080 to 4200. Your launch.json should look like this:
{
    // Use IntelliSense to learn about possible attributes.
    // Hover to view descriptions of existing attributes.
    // For more information, visit: https://go.microsoft.com/fwlink/?linkid=830387
    "version": "0.2.0",
    "configurations": [
        {
            "type": "chrome",
            "request": "launch",
            "name": "Launch Chrome against localhost",
            "url": "http://localhost:4200",
            "webRoot": "${workspaceFolder}"
        }
    ]
}