Blazor - Get Started with Smart.PivotTable
Setup The Project
Follow the Getting Started guide to set up your Blazor Application with Smart UI.
Setup Basic PivotTable
Smart.PivotTable can be used to summarize large amount of data and establish hierarchy between the columns.
- Add the PivotTable component to the Pages/Index.razor file
<PivotTable></PivotTable>
- Inside the
@codeblock, declare the PivotTable Columns and set them as properties of the PivotTable component.
The columns can be set as either row groups or pivot columns. The Summary property aggregates the column's data for each pivot data point.List <PivotTableColumn> columns = new List <PivotTableColumn>() { new PivotTableColumn() { Label = "Country", DataField = "Country", DataType = PivotTableColumnDataType.String, AllowRowGroup = true, RowGroup = true }, new PivotTableColumn() { Label = "City", DataField = "City", DataType = PivotTableColumnDataType.String, AllowRowGroup = true, RowGroup = true }, new PivotTableColumn() { Label = "Office Name", DataField = "OfficeName", DataType = PivotTableColumnDataType.String, AllowRowGroup = true, RowGroup = true }, new PivotTableColumn() { Label = "Year", DataField = "Year", Pivot = true, AllowPivot = true, DataType = PivotTableColumnDataType.Number }, new PivotTableColumn() { Label = "Employees", DataField = "Employees", DataType = PivotTableColumnDataType.Number, Summary = PivotTableColumnSummary.Sum }, new PivotTableColumn() { Label = "Revenue", DataField = "Revenue", DataType = PivotTableColumnDataType.Number, Summary = PivotTableColumnSummary.Sum }, }; - Create an example Office data and bind it to the PivotTable using the
Datasourceproperty<PivotTable DataSource="@offices" Columns="@columns"></PivotTable> @code{ ... class Office { public string Country { get; set; } public string City { get; set; } public string OfficeName { get; set; } public int Year { get; set; } public int Employees {get; set; } public double Revenue { get; set; } public Office(string country, string city, string officeName, int year, int emlpoyees, double revenue){ Country = country; City = city; OfficeName = officeName; Year = year; Employees = emlpoyees; Revenue = revenue; } } Office[] offices = new Office[] { new Office("USA", "New York", "Office #1", 2020, 20, 50000), new Office("USA", "New York", "Office #2", 2020, 15, 55000), new Office("USA", "New York", "Office #3", 2020, 25, 57000), new Office("USA", "New York", "Office #4", 2020, 8, 39000), new Office("USA", "New York", "Office #1", 2021, 22, 38500), new Office("USA", "New York", "Office #2", 2021, 16, 42500), new Office("USA", "New York", "Office #3", 2021, 8, 50500), new Office("USA", "New York", "Office #4", 2021, 21, 36000), new Office("USA", "Los Angeles", "Office #1", 2020, 10, 20000), new Office("USA", "Los Angeles", "Office #2", 2020, 13, 31500), new Office("USA", "Los Angeles", "Office #3", 2020, 20, 40000), new Office("USA", "Los Angeles", "Office #1", 2021, 16, 37000), new Office("USA", "Los Angeles", "Office #2", 2021, 15, 35000), new Office("USA", "Los Angeles", "Office #3", 2021, 25, 50000), new Office("USA", "Texas", "Office #1", 2020, 8, 15000), new Office("USA", "Texas", "Office #1", 2021, 5, 8000), new Office("Germany", "Berlin", "Office #1", 2020, 15, 39000), new Office("Germany", "Berlin", "Office #2", 2020, 20, 50150), new Office("Germany", "Berlin", "Office #1", 2021, 16, 45500), new Office("Germany", "Berlin", "Office #2", 2021, 24, 59000), new Office("Germany", "Munich", "Office #1", 2020, 12, 29000), new Office("Germany", "Munich", "Office #1", 2021, 12, 29500), new Office("UK", "London", "Office #1", 2020, 30, 60000), new Office("UK", "London", "Office #2", 2020, 10, 40000), new Office("UK", "London", "Office #3", 2020, 9, 41000), new Office("UK", "London", "Office #1", 2021, 26, 58550), new Office("UK", "London", "Office #2", 2021, 12, 51000), new Office("UK", "London", "Office #3", 2021, 11, 39500), }; }
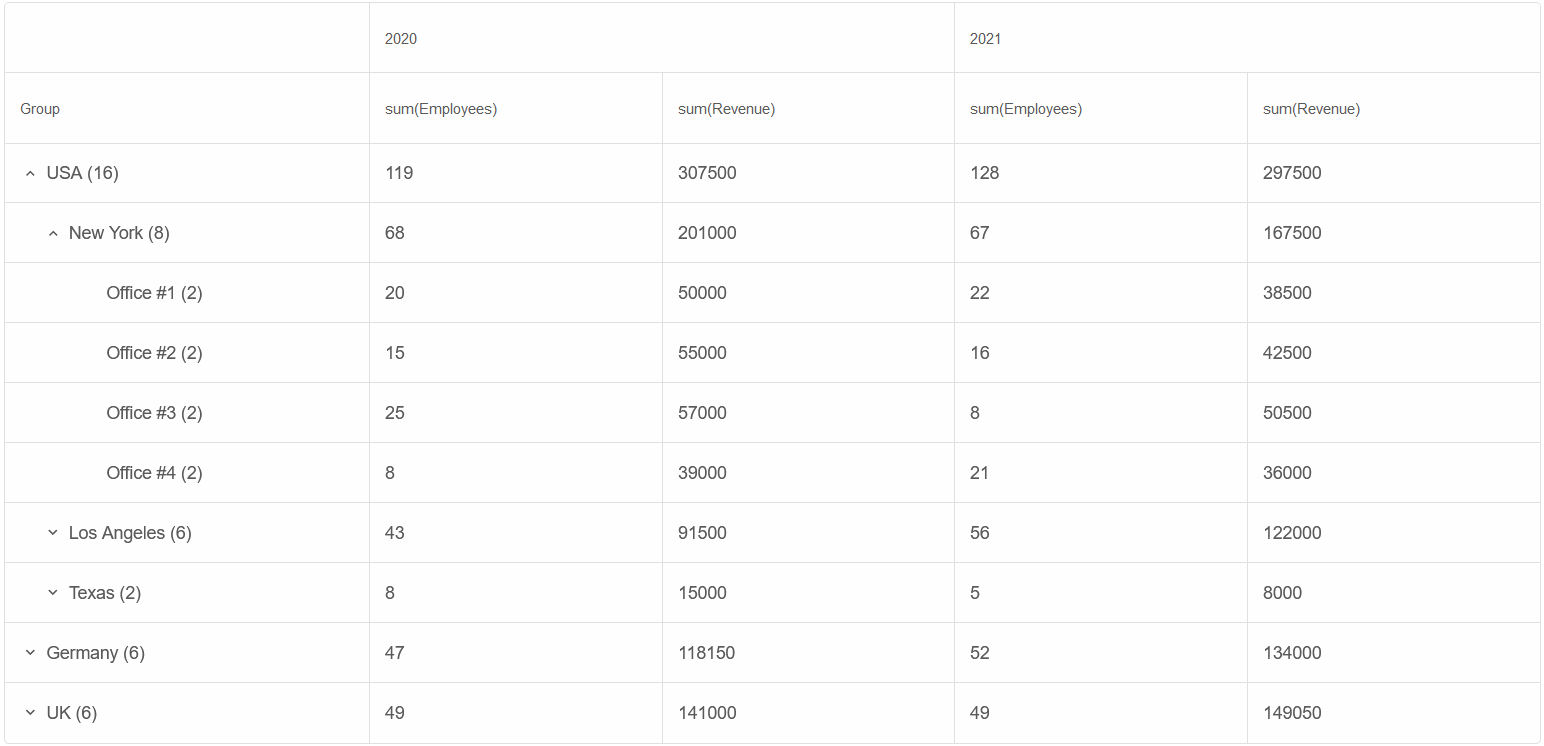
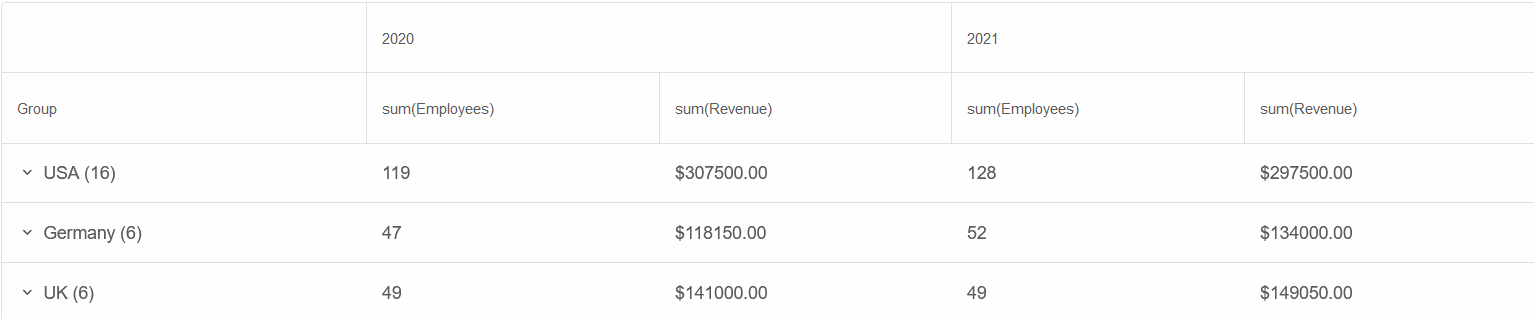
Format Summary
The SummarySettings property allows you to format the data inside a Summary Column.
Modify the Revenue column to include a prefix and decimals.
new PivotTableColumn() {
  Label = "Revenue",
  DataField = "Revenue",
  DataType = PivotTableColumnDataType.Number,
  Summary = PivotTableColumnSummary.Sum,
        SummarySettings = new {
    prefix = "$",
    decimalPlaces = 2
  }
}
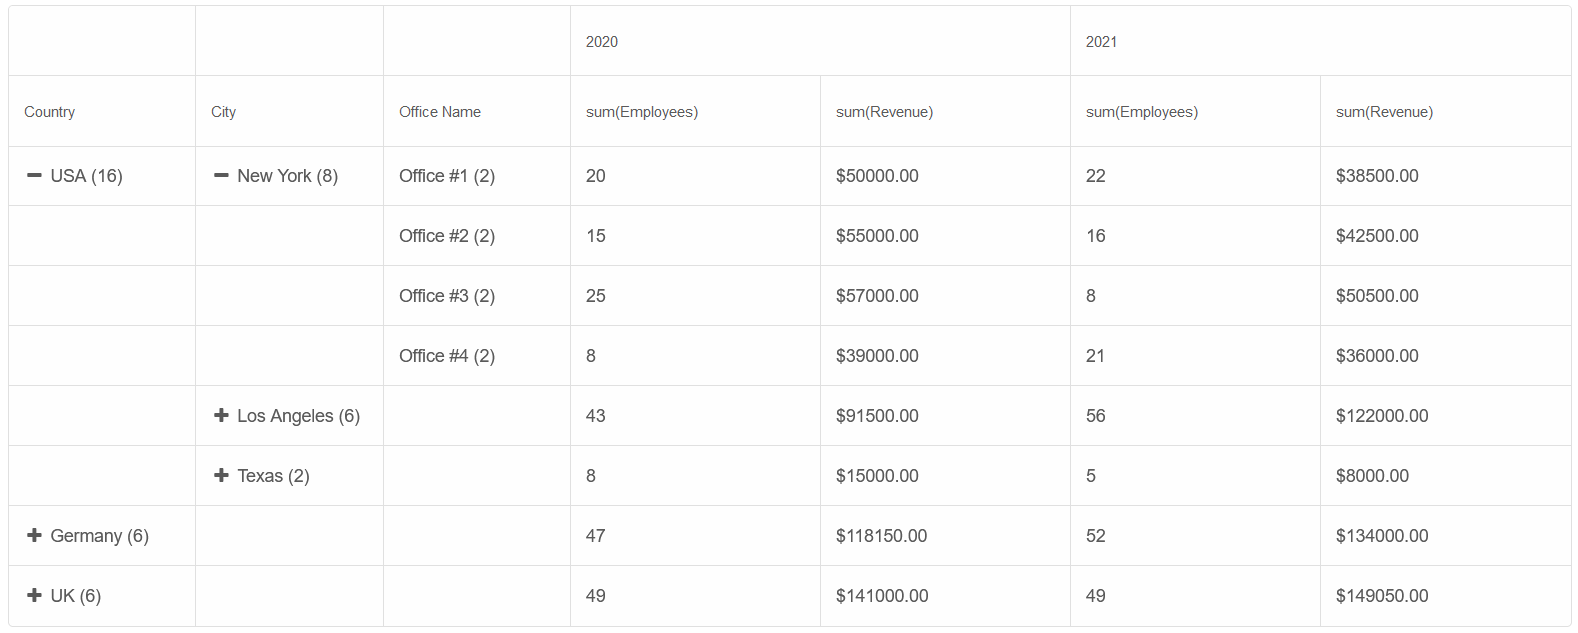
Group Layout
Smart.PivotTable can display the data in two different layouts -
the Default tree layout or Classic layout, which creates a seperate column for each nested level.
Set the GroupLayout property to Classic.
<PivotTable Columns="@columns" DataSource="offices" GroupLayout="PivotTableGroupLayout.Classic">
</PivotTable>
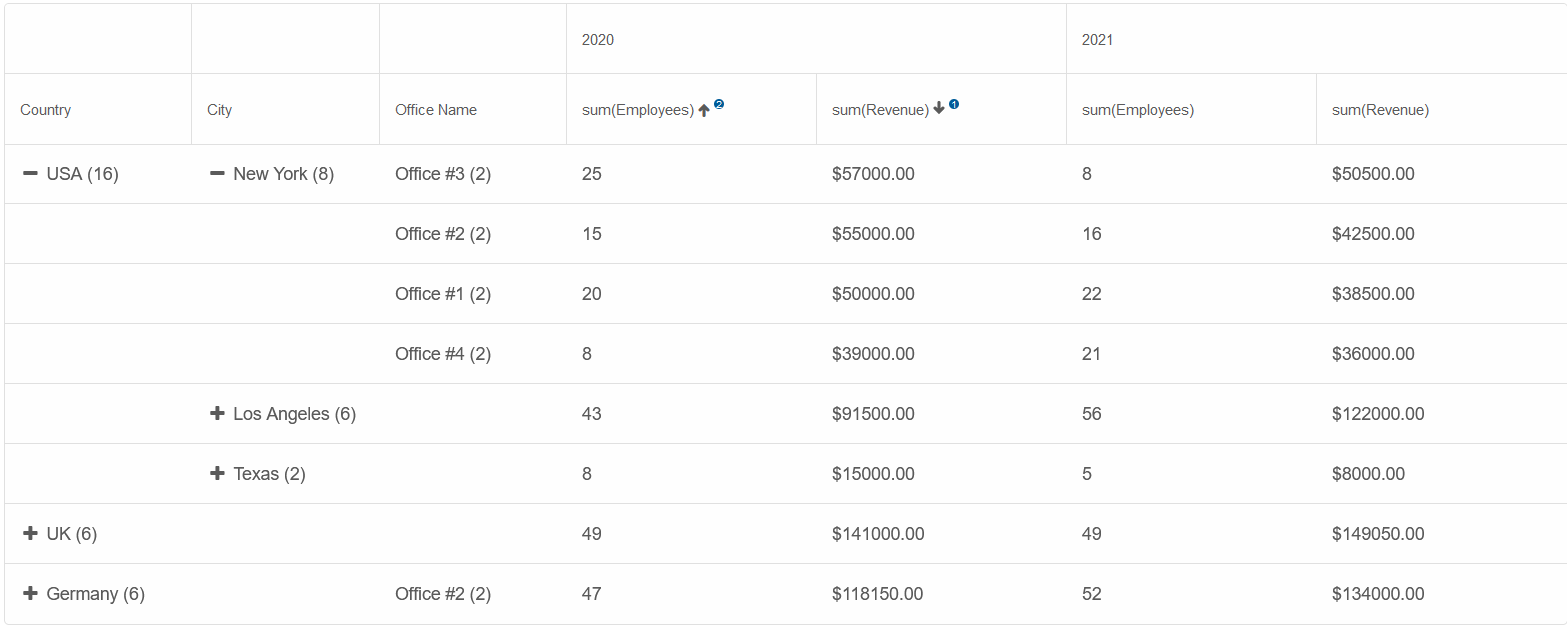
Sort Data
Smart.PivotTable offers multiple sorting modes - Simple Sort by one column or Sort by multiple columns.
<PivotTable Columns="@columns" DataSource="offices" GroupLayout="PivotTableGroupLayout.Classic" SortMode="PivotTableSortMode.Many">
</PivotTable>
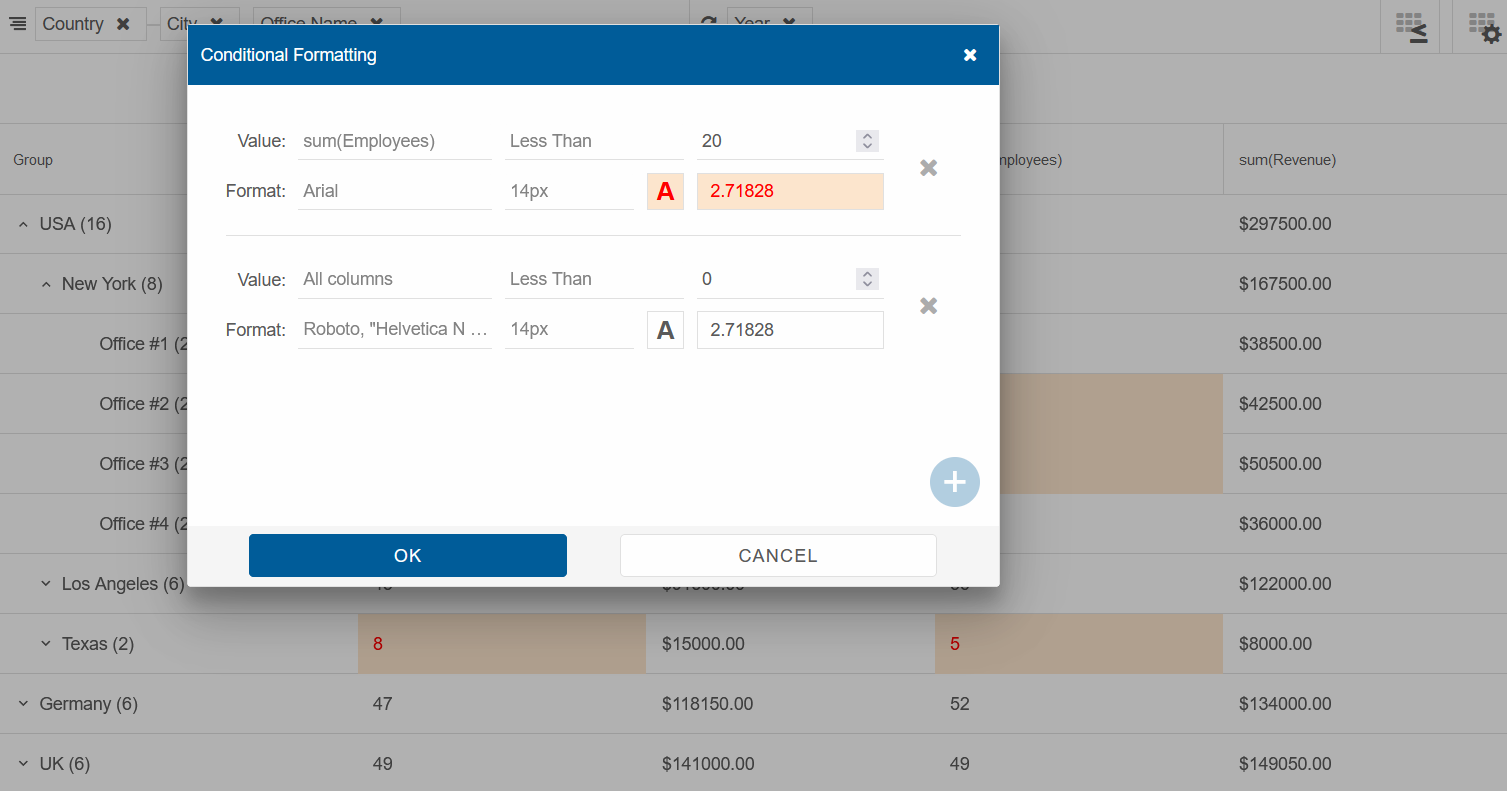
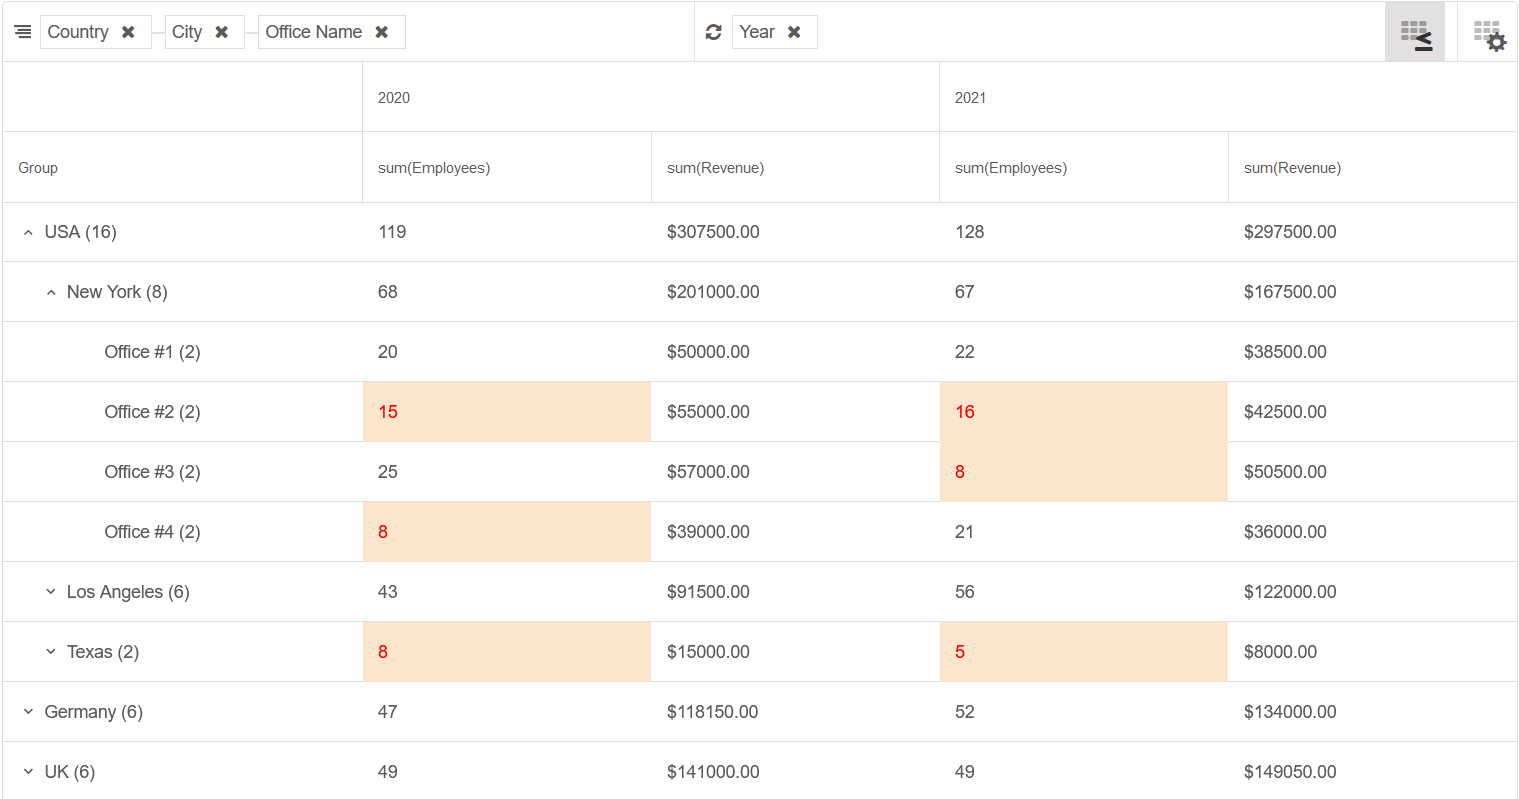
PivotTable Toolbar
The Smart.PivotTable Toolbar features drag-drop areas for manipulating the row group and pivot columns as well as the "Conditional formatting" and "Fields" modals, which allow you to further customize the Table without the need to write any code.
<PivotTable Columns="@columns" DataSource="offices"  GroupLayout="PivotTableGroupLayout.Default"
  SortMode="PivotTableSortMode.Many" Toolbar="true" />
</PivotTable>
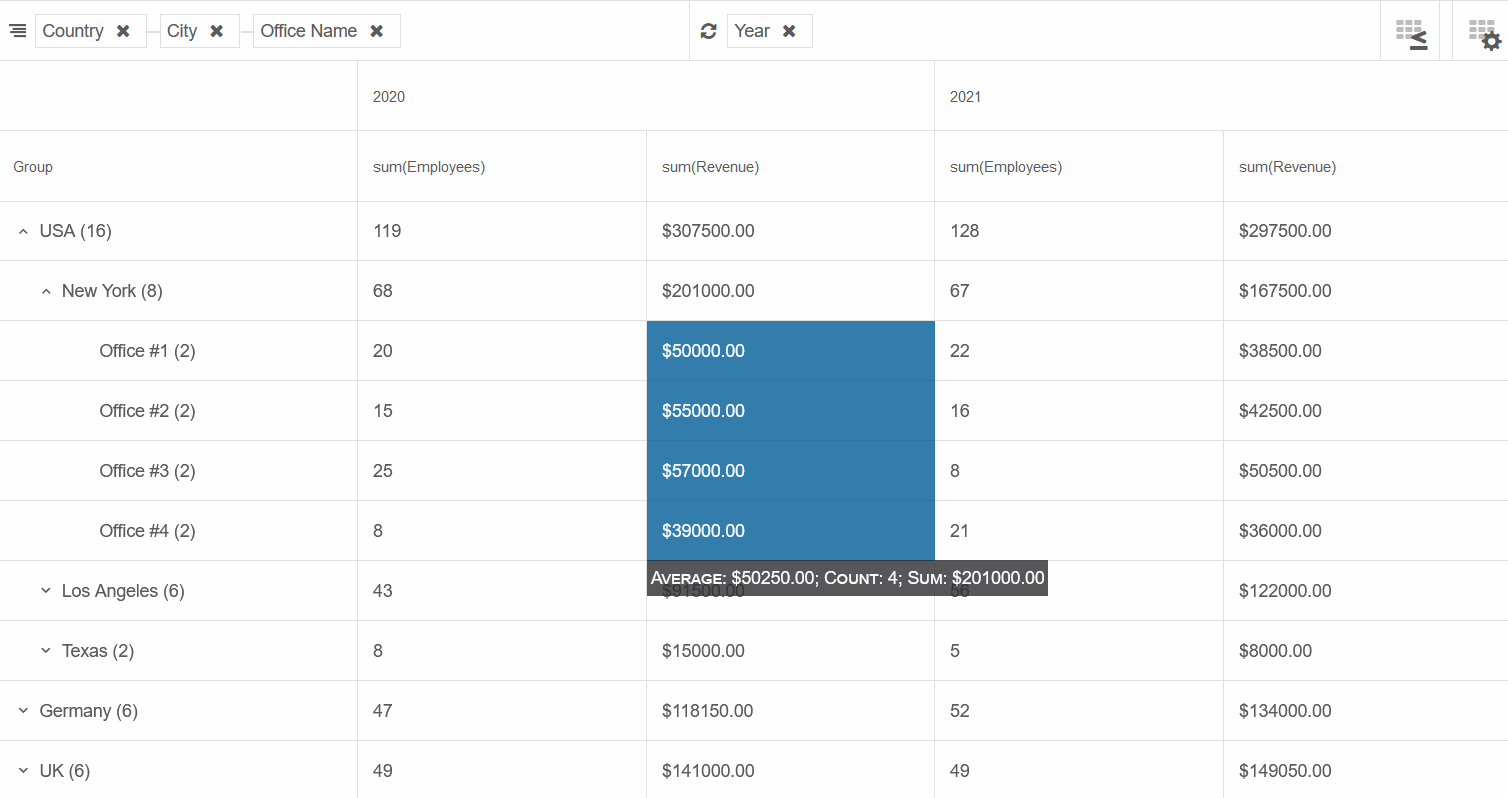
Cell Selection & Selection Details
Smart.PivotTable provides multiple ways for the user to select data from the Pivot.
Set the Selection property to true and choose the selection mode through the SelectionMode property.
When multiple cells with non-null summary values are selected, a tooltip showing the Average, Count, and Sum of the values is displayed.
<PivotTable Columns="@columns" DataSource="offices"  GroupLayout="PivotTableGroupLayout.Default"
  SortMode="PivotTableSortMode.Many" Toolbar="true" Selection="true" SelectionMode="PivotTableSelectionMode.Cell">
</PivotTable>