Build your web apps using Smart Custom Elements
Smart GanttChart - Resource Management
Resources
Smart GanttChart's tasks represent real life processes and operations that can be managed. As such they have people or materials assigned to them. GanttChat's Resource Management allows to assign resources to tasks and monitor they workflow.
Resource have the following properties:
- id - a unique id that identifies the resource. Mandatory attribute
- class - a CSS class name that will be applied to the corresponding resource cells in the Resource Timeline.
- label - a label for the Resource that will appear in the Resource Table.
- value - Resource's value.
- type - Resource's type.
- hidden - determines whether the resource will be visible in the Resource Panel or not.
- capacity - the capacity of the resource.
- maxCapacity - the maximum capacity of the resource.
- minCapacity - the minimum capacity of the resource.
- progress - indicates the progress of the resource. This propertry is automatically calculated based on the task progress that it's assigned to.
- workload - indicates the maximum possible workload of the resource. This property is automatically calculated by the element. It is the result of combining the duration of the tasks that the resource is assigned to (taking nonworking time into account) by multipying it to the maxCapacity of the resource. The workload is always measured in hours a day.
- assignedTo - an array of task ids that indicates which tasks have the resource assigned. This property is not used when initializing via dataSource.
Resources can be created on initialization or dynamically:
-
As part of dataSource:
cosnt ganttChart = document.querySelector('jqx-gantt-chart');

 ganttChart.dataSource = [
                {
                    label: 'Project',
                    synchronized: true,
                    expanded: true,
                    disableResources: true,
                    type: 'project',
                    tasks: [
                        {
                            id: 'task1',
                            label: 'Task 1',
                            dateStart: '2020-02-01',
                            dateEnd: '2020-02-10',
                            progress: 50,
                            resources: [{
                                id: 'megan',
                                label: 'Megan',
                            }]
                        },
                    ...
                        {
                            label: 'Task 2',
                            dateStart: '2020-03-21',
                            dateEnd: '2020-03-31',
                            progress: 45,
                            type: 'task',
                            resources: 'megan'
                        }
                    ...
                    ]
                }];
The resources property is a task property of type Array. However if the resource is just one it can be defined as an Object.
In the following example, in the 'Task 1' definition we initialize and assign a single resource as an Array with id 'megan'. Later inside 'Task 2' we assign the same resource by using it's id and passing it as a string to the resources property. This is acceptable since we are referencing an already created resource. However re-initializing it again in the same way will also assign the resource.
-
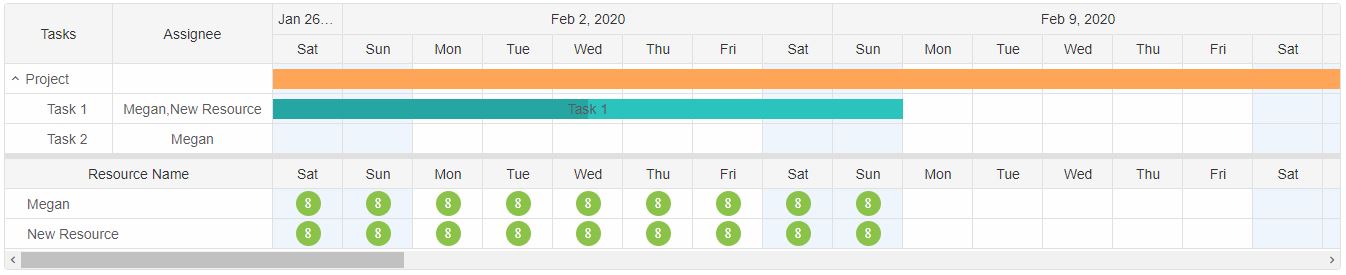
Dynamically added via the API method insertResource -
cosnt ganttChart = document.querySelector('jqx-gantt-chart');
const resource = {
            id: 'new-resource',
            label: 'New Resource'
        };

        //Insert the new resource
        ganttChart.insertResource(resource);

        //Assign the resource to Task 1
        ganttChart.updateTask(1, { resources: ['megan' ,'new-resource'] });
The following example inserts a new resource at the last position in the resource list while assigning it to the task with id 'task1'.
Resources can be dynamically assigned to individual tasks using the updateTask method or via the GanttChart Window Editor.
Resource can also be delete or updated via the corrensponding methods:
- updateResource - accepts two arguments - the id of the target resource and an object with resource properties containing new values to be updated.
- removeResource - accepts only one argument - the id of the target resource.
cosnt ganttChart = document.querySelector('jqx-gantt-chart');
const settings = {
            label: 'Updated Resource'
        };

        //Updates resource with id = 'new resource'
        ganttChart.updateResource('new-resource', settings);

        //Remove resource with id = 'new-resource'
        ganttChart.removeResource('new-resource');
A complete list of all GanttChart resources can be retrieved via the resources getter.
const resources = document.querySelector('jqx-gantt-chart').resources;
Resource Panel
When the GanttChart contains resources the Resource Panel is automatically displayed under the Task Panel. It resembles the Task Panel in the following aspects:- Resource Table - a Table with the resources that are currently assigned and visible. The table can have multiple columns as well defined by the resourceColumns property.
- Resource Timeline - a Timeline that contains the same header cells as the Task Timeline but unlike it shows the workload of the resources. The timeline cells are populated according to the assignments of the resources.
The Resource Panel's visibility is automatically determined by the GanttChart. When there are no resources to display it is hidden and vice versa. However the user can hide the Resource panel permanently via the hideResourcePanel property.
The size of the Resource Panel can be controlled via the resourcePanelSize and resourcePanelMin properties.
Selecting an item from the Resource Panel or the Task Panel will highlight the corresponding items assigned. The highlighted cells will be colored via a CSS variable. The highlighter is removed when there's no selection.
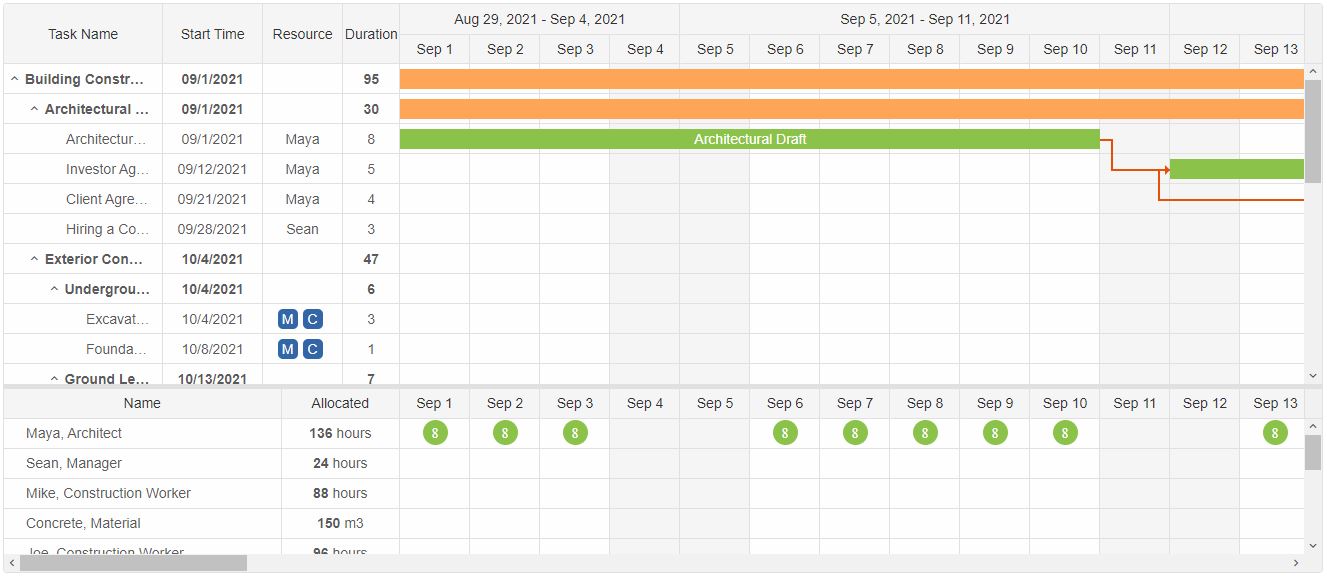
The following screenshot inllustrates an advanced usage of the Resource Panel with two resource table columns and more then one resource assigned to different tasks. Some tasks have more than one resource assigned. The resources include materials and workers for a building construction project.
Resource Table
The Resource Table can display any property of the resources or a custom column that the user can populate with data using the formatFunction callback of the column object definition. Using the Resource Table is similar to the Task Table. Here's an example where three columns are created:
cosnt ganttChart = document.querySelector('jqx-gantt-chart');

ganttChart.resourceColumns = [
                {
                    label: 'Name',
                    value: 'label',
                    size: '40%'
                },
                {
                    label: 'Completion',
                    value: 'progress',
                    formatFunction: (data, item) => data + '%',
                    size: '20%'
                },
                {
                    label: 'Workload',
                    value: 'workload',
                    formatFunction: (data, item) => data + 'h',
                    size: '20%'
                }
            ];
...
The columns have the following properties:
- label - the title of the columns that will be displayed in the header.
- value - the resource property that will be displayed in the column.
- formatFunction - a formatting function that allows to customize the values in the column. It has two arguments: the data that will be displayed in the table row and the index of the item.
- size - the size of the column.
The Resource properties that will be displayed according to value are:
- label - the label of the resource.
- progress - the total progress of the tasks that the resource is assigned to.
- workload - the total working time (in hours a day) of the resource according to the tasks it is assigned to.
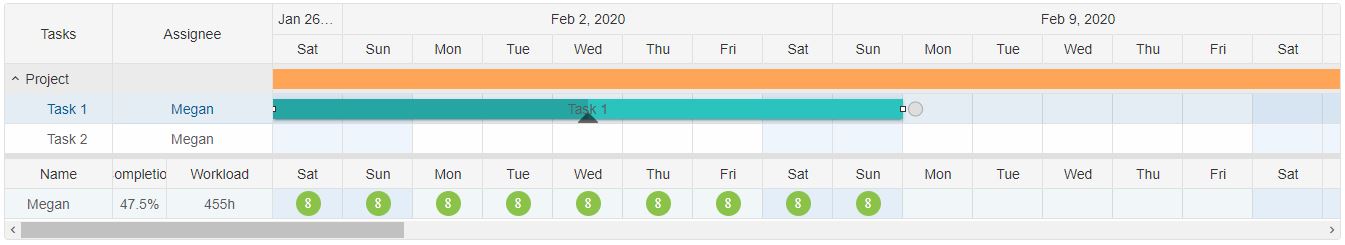
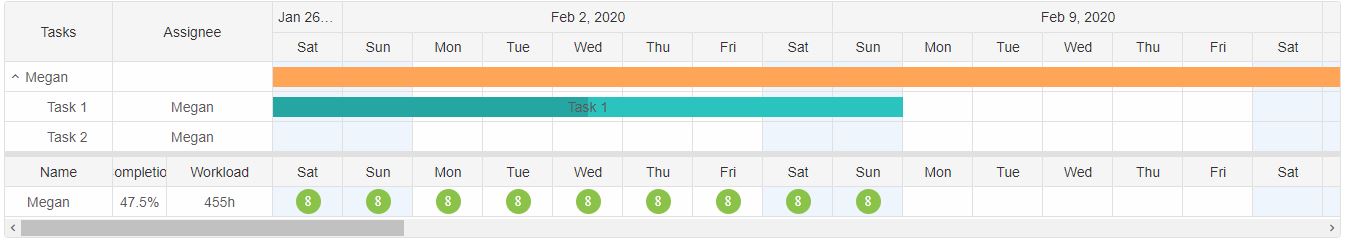
The following example shows how to create multiple columns in the Resource Table and customize the value of the table rows via the formatFunction property.
The Size of the Resource Table is always the same as the size of the Task Table and is determined by the treeSize and treeMin properties.
Resource Timeline
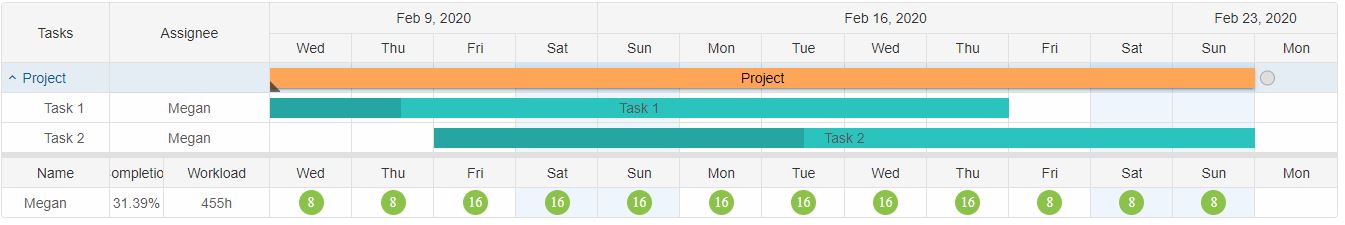
Resource Timeline uses the same time span and header as the Task Timeline but it shows information regarding the resources. Since resources are assigned to specific tasks, the timeline cells that show the span of the task are populated with data. By default the Resource Timeline shows the capacity of the resources in every cell that the corresponding task occupies. However the Timeline has multiple modes that display different data. This is determined by the resourceTimelineMode:
-
diagram - shows the capacity of the resources in the cells that a task uses. The value
that will be displayed in the cells represents the actual capacity property of the resource
which is taken as the number of hours a day a person works. It can range from 0 to the actual
value of the capacity property according to the task duration. Since the Timeline
view can be changed to different ranges the capacity is recalculated to display the
appropriate capacity for the given time range.
Here's an exmaple:
-
histogram - turns the Timeline into a histogram that shows a graphical representation of
the proportion between the capacity and maxCapacity properties of the resources.
Each cell contains a representation of the distribution of the resource capacity using a
colored bar.
Here's an exmaple:
cosnt ganttChart = document.querySelector('jqx-gantt-chart');

ganttChart.resourceTimelineMode = 'histogram';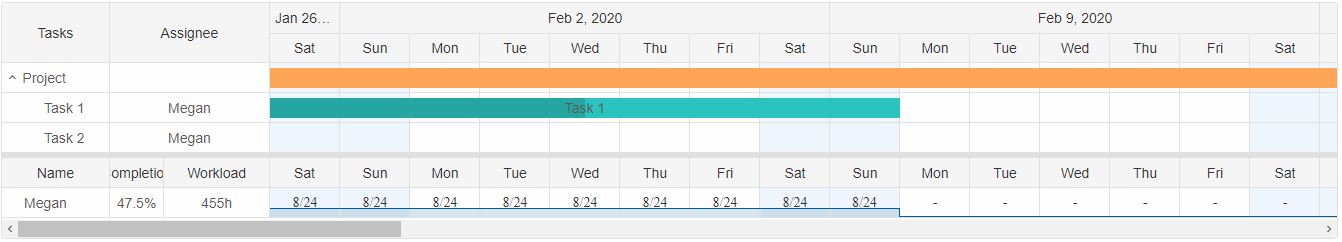
-
custom - allows to place custom HTML content inside the cells that are used by the
assigned task. The content is defined via the resourceTimelineFormatFunction callback.
Here's an exmaple:
cosnt ganttChart = document.querySelector('jqx-gantt-chart');

ganttChart.resourceTimelineMode = 'custom';
ganttChart.resourceTimelineFormatFunction = function (assignedTasks, index, cellDate) {
        return '✓'
    };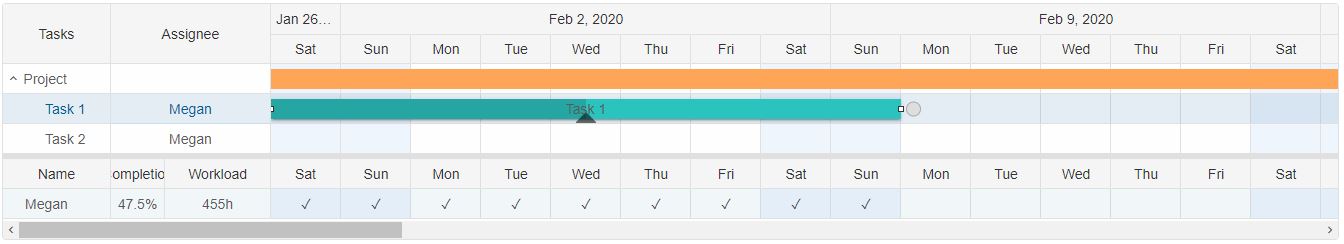
resourceTimelineFormatFunction takes three arguments:
- assignedTasks - an Array of the indexes of the tasks that the resource is assigned to.
- index - the index of the resources.
- cellDate - the date of the current cell that is going to be customized.
The data displayed by the resourceTimelineMode can be customized as well. This is usefull when the user wants to show for example a histogram with custom data. The data that is used for the Diagram and Histogram is determined by the resourceTimelineView. This property has the following options:
- hours - using the capacity and maxCapacity properties of the resources the Timeline show capacity in hours per day.
- tasks - using the task assigments the Timeline shows the number of tasks assigned to the resources per cell.
-
custom - allows to customize the data used for the Diagram and Histogram via the
resourceTimelineFormatFunction callback. The expected result from the callback is
according to the resourceTimelineMode:
-
diagram - the Diagram mode uses a single argument to present data. The expected
return result from the callback is a single variable. However if multiple are passed as
(in an object) the first one will be taken into account.
cosnt ganttChart = document.querySelector('jqx-gantt-chart');

ganttChart.resourceTimelineView = 'custom';
ganttChart.resourceTimelineFormatFunction = function (assignedTasks, index, cellDate) {
                const gantt = document.querySelector('jqx-gantt-chart'),
                    tasks = gantt.tasks;
                let total = 0;

                for (let i = 0; i < assignedTasks.length; i++) {
                    const taskLabel = tasks[assignedTasks[i]].label;

                    //Extra bonus points for weekends
                    if (taskLabel === 'Task 1') {
                        total += 1;
                    }
                    else {
                        total += 2;
                    }
                }

                //return { value: total }; //Correct return result
                //return  total; //Correct return result
                return { value: total, max: 10 }; //Correct return result
            };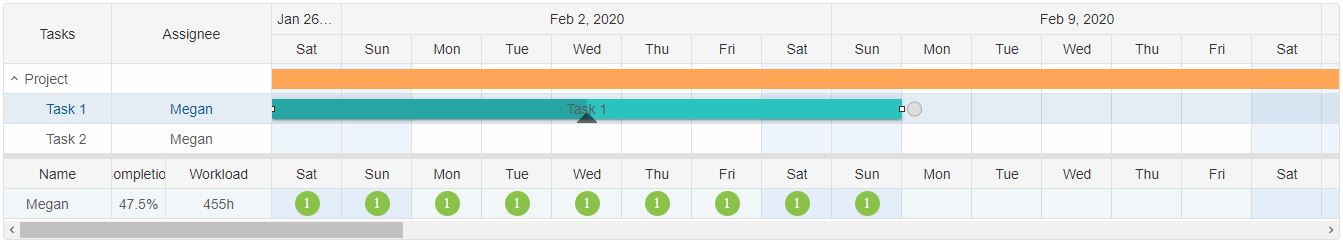
-
histogram - the Histogram mode uses two arguments to present data: the value and
it's maximum. The expected return result from the callback is an object with two
attributes.
cosnt ganttChart = document.querySelector('jqx-gantt-chart');

ganttChart.resourceTimelineView = 'custom';
ganttChart.resourceTimelineFormatFunction = function (assignedTasks, index, cellDate) {
                const gantt = document.querySelector('jqx-gantt-chart'),
                    tasks = gantt.tasks;
                let total = 0;

                for (let i = 0; i < assignedTasks.length; i++) {
                    const taskLabel = tasks[assignedTasks[i]].label;

                    //Extra bonus points for weekends
                    if (taskLabel === 'Task 1') {
                        total += 1;
                    }
                    else {
                        total += 2;
                    }
                }

                //return { value: total }; //Incorrect return result
                //return  total; //Incorrect return result
                return { value: total, max: 10 }; //Correct return result
            };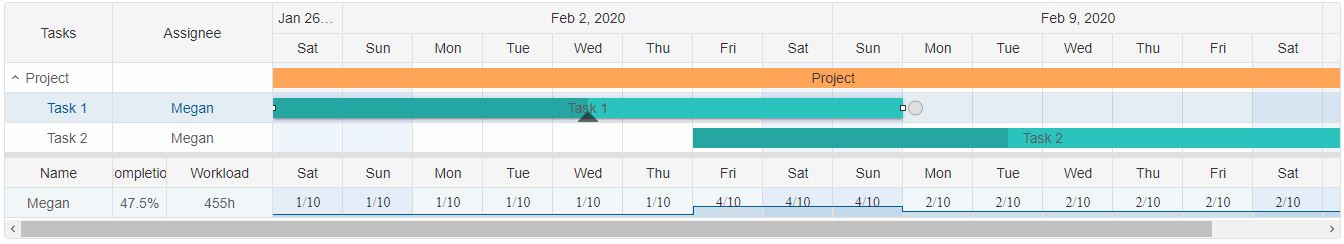
-
diagram - the Diagram mode uses a single argument to present data. The expected
return result from the callback is a single variable. However if multiple are passed as
(in an object) the first one will be taken into account.
Group By Resources
GanttChart element has the abbility to group the tasks based on the resources they have assigned via the groupByResources property. When enabled, the content of the Table and Timeline is updated in order to show the grouped tasks according to their resources. The resource groups are presented as synchronized projects inside the Timeline and their tasks are the actual tasks that the resource is assigend to. All unassigned tasks are added to an automatically created group called Unassigned. The purpose of this feature is to observe all Tasks and Resources in a single Timeline.
cosnt ganttChart = document.querySelector('jqx-gantt-chart');

ganttChart.groupByResources = true;
Task resources can be disabled via the disableResources boolean property. When applied to a task/project/milestone it cannot have resources assigned and will not be included in the resource view. The resource groups cannot have resources assigned to them since they represent the actual resources.
cosnt ganttChart = document.querySelector('jqx-gantt-chart');

 ganttChart.dataSource = [
                {
                    label: 'Project',
                    synchronized: true,
                    expanded: true,
                    disableResources: true, //disables resources for the Project
                    type: 'project',
                    tasks: [
                        {
                         ...
                        }
                    ]
                }];
For AI tooling
Developer Quick Reference
Topic: gantt-resource-management Component: GanttChart Framework: JavaScript
Main methods: insertResource(), updateTask(), updateResource(), removeResource()
Common config keys: (none detected)
Implementation Notes
Compatibility: Modern browsers / Web Components API access pattern: const component = document.querySelector(...) + component.method()
Lifecycle guidance: Initialize configuration first, then invoke imperative API when element is available in DOM.
Common pitfalls:
- Calling methods before element initialization.
- Reassigning large configuration partially without understanding merge behavior.
- Missing required module script import for component type.
Validation checklist:
- Ensure module scripts and CSS are loaded once.
- Keep data schema aligned with columns/series definitions.
- Verify method calls target initialized component instance.