Blazor Smart.PivotTable Columns
Setup The Project
Follow the Getting Started guide to set up your Blazor Application with Smart UI.
Setup the Blazor Smart.PivotTable
Follow the Get Started with Smart.PivotTable guide to set up the component.
PivotTable Columns
PivotTable has two types of columns - the original columns, that correspond to the ones from the grid/table/database the data is retrieved from, and the dynamic columns which are the columns visible in the PivotTable after the data has been processed.
PivotTable Original Columns
The original columns are defined in the PivotTable's settings by setting the Columns property.
Here is a sample configuration:
  List<PivotTableColumn> columns = new List<PivotTableColumn>()
  {
        new PivotTableColumn()
        {
            Label = "Last Name",
            DataField = "LastName",
            DataType = PivotTableColumnDataType.String,
            AllowRowGroup = true,
            RowGroup = true
        },
        new PivotTableColumn()
        {
            Label = "First Name",
            DataField = "FirstName",
            DataType = PivotTableColumnDataType.String,
            AllowRowGroup = true,
            RowGroup = true
        },
        new PivotTableColumn()
        {
            Label = "Product Name",
            DataField = "ProductName",
            Pivot = true,
            AllowPivot = true,
            DataType = PivotTableColumnDataType.String
        },
        new PivotTableColumn()
        {
            Label = "Quantity",
            DataField = "Quantity",
            DataType = PivotTableColumnDataType.Number,
            Summary = PivotTableColumnSummary.Sum
        },
        new PivotTableColumn()
        {
            Label = "Price",
            DataField = "Price",
            DataType = PivotTableColumnDataType.Number,
            Summary = PivotTableColumnSummary.Sum,
            SummarySettings = new
            {
                prefix = "$",
                decimalPlaces = 2
            }
        }
  };
To be visualized in the PivotTable, a column has to have at least one role, configured by setting one of the properties:
- Pivot - data from pivot columns is represented as column hierarchy in the PivotTable (see image below - (1)). Whether or not a column can be a pivot column is determined by AllowPivot. Pivot columns are optional.
- RowGroup - data from row group columns is represented as rows in the PivotTable (see image below - (2)). Whether a column can be a row group column is determined by AllowRowGroup. Row group columns are optional.
-
Summary - determines the summary function to aggregate the column's data by and produce dynamic summary columns for each unique pivot data point. There must always be at least one summary column for the PivotTable to make sense (see image below - (3)). Summary is of type
PivotTableColumnSummarythat is an enum with the following possible values:- Avg - Average
- Count - Count
- Max - Maximum
- Median - Median
- Min - Minimum
- Product - Product
- Stdev - Standard deviation
- Stdevp - Standard deviation based on the entire population
- Sum - Sum
- Var - Variance
- Varp - Variance based on the entire population
PivotTable Dynamic Columns
Once the PivotTable's data source and original columns array are processed, dynamic columns with summarized data are produced and populated. Here is an image that shows a Smart.PivotTable with dynamic columns based on the columns array from above:
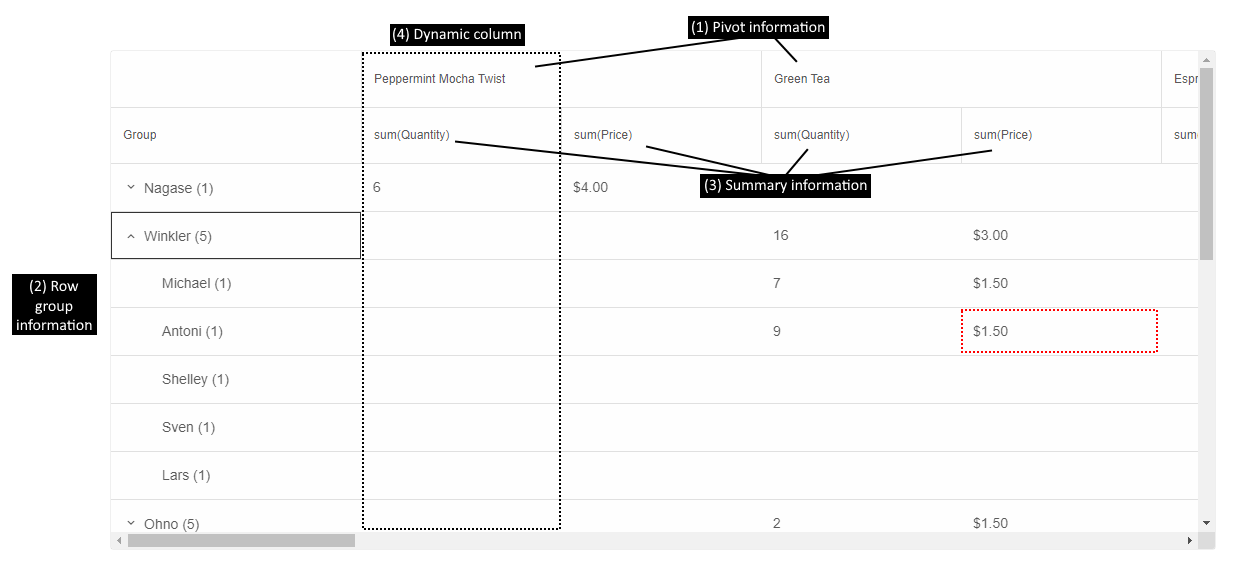
The cell highlighted in red in the image shows the sum of the prices (Summary (3)) of all products Green Tea (Pivot (1)), purchased by everyone named Antony Winkler (RowGroup (2)).
There can be multiple pivot, row group, and summary columns. The order in which they appear in the PivotTable depends on the order in which they are configured in the columns array. That is why, in this case, rows are first grouped by Last Name, then by First Name and sum(Quantity) is before sum(Price).
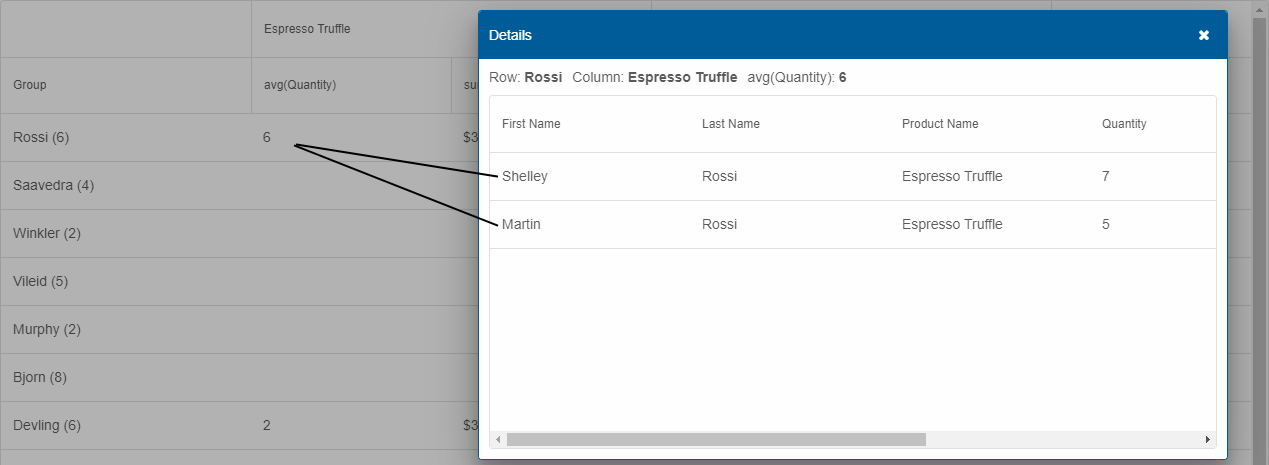
PivotTable Drill Down
Each cell in PivotTable may summarize one or more original data points. If the property DrillDown is enabled, the user can double-click a cell to show a Smart.Table in a dialog with all records aggregated in the clicked PivotTable cell.