Smart.Chart Polar & Spider
Setup The Blazor Application
Follow the Getting Started guide to set up your Blazor Application with Smart UI.
Setup the Blazor Smart.Chart
Follow the Get Started with Smart.Chart guide to set up the component.
Chart Types
Read the Smart.Chart Types guide to understand how to use the different chart types.
Polar & Spider
Most of the Chart's types can be rendered as a polar (or spider) chart - a graphical method of displaying multivariate data in the form of a two-dimensional chart of three or more quantitative variables.
In Smart.Chart, this functionality is enabled by setting Polar to true to a series group.
A full example is given below:
<Chart DataSource="sampleData" Caption="U.S. Real Home Price vs Building Cost Indeces (1950-2010)" Description="Source: http://www.econ.yale.edu/~shiller/data.htm"
           ShowLegend Padding="new Padding() { Left = 5, Top = 5, Right = 5, Bottom = 5 }" TitlePadding="new Padding() { Left = 0, Top = 0, Right = 0, Bottom = 5 }"
           ColorScheme="ChartColorScheme.Scheme01" XAxis="xAxis" SeriesGroups="seriesGroups" />

@code {
    List<Dictionary<string, object>> sampleData = new List<Dictionary<string, object>>()
    {
        new Dictionary<string, object>() { { "Year", "1950" }, { "HPI", "105.8948393" }, { "BuildCost", "59.9171862" }, { "Population", "151.684" }, { "Rate", "0.0232" }, { "uid", 0 } },
        new Dictionary<string, object>() { { "Year", "1951" }, { "HPI", "103.8986687" }, { "BuildCost", "59.2786986" }, { "Population", "154.287" }, { "Rate", "0.0257" }, { "uid", 1 } },
        new Dictionary<string, object>() { { "Year", "1952" }, { "HPI", "103.9743275" }, { "BuildCost", "58.94343772" }, { "Population", "156.954" }, { "Rate", "0.0268" }, { "uid", 2 } },
        new Dictionary<string, object>() { { "Year", "1953" }, { "HPI", "113.8451588" }, { "BuildCost", "60.8392201" }, { "Population", "159.565" }, { "Rate", "0.0283" }, { "uid", 3 } },
        new Dictionary<string, object>() { { "Year", "1954" }, { "HPI", "115.6204181" }, { "BuildCost", "62.25447619" }, { "Population", "162.391" }, { "Rate", "0.0248" }, { "uid", 4 } },
        new Dictionary<string, object>() { { "Year", "1955" }, { "HPI", "115.5419272" }, { "BuildCost", "65.95528267" }, { "Population", "165.275" }, { "Rate", "0.0261" }, { "uid", 5 } },
        new Dictionary<string, object>() { { "Year", "1956" }, { "HPI", "113.7942463" }, { "BuildCost", "68.79148786" }, { "Population", "168.221" }, { "Rate", "0.029" }, { "uid", 6 } },
        new Dictionary<string, object>() { { "Year", "1957" }, { "HPI", "113.6664365" }, { "BuildCost", "69.24632104" }, { "Population", "171.274" }, { "Rate", "0.0346" }, { "uid", 7 } },
        new Dictionary<string, object>() { { "Year", "1958" }, { "HPI", "111.7970971" }, { "BuildCost", "68.9257142" }, { "Population", "174.141" }, { "Rate", "0.0309" }, { "uid", 8 } },
        new Dictionary<string, object>() { { "Year", "1959" }, { "HPI", "110.4583238" }, { "BuildCost", "70.95296772" }, { "Population", "177.13" }, { "Rate", "0.0402" }, { "uid", 9 } },
        new Dictionary<string, object>() { { "Year", "1960" }, { "HPI", "109.6495745" }, { "BuildCost", "71.63614258" }, { "Population", "180.76" }, { "Rate", "0.0472" }, { "uid", 10 } },
        new Dictionary<string, object>() { { "Year", "1961" }, { "HPI", "109.5092421" }, { "BuildCost", "71.568197" }, { "Population", "183.742" }, { "Rate", "0.0384" }, { "uid", 11 } },
        new Dictionary<string, object>() { { "Year", "1962" }, { "HPI", "108.7289429" }, { "BuildCost", "72.59299982" }, { "Population", "186.59" }, { "Rate", "0.0408" }, { "uid", 12 } },
        new Dictionary<string, object>() { { "Year", "1963" }, { "HPI", "109.1195568" }, { "BuildCost", "73.36701774" }, { "Population", "189.3" }, { "Rate", "0.0383" }, { "uid", 13 } },
        new Dictionary<string, object>() { { "Year", "1964" }, { "HPI", "109.8522455" }, { "BuildCost", "74.36711732" }, { "Population", "191.927" }, { "Rate", "0.0417" }, { "uid", 14 } },
        new Dictionary<string, object>() { { "Year", "1965" }, { "HPI", "109.2636597" }, { "BuildCost", "75.45724616" }, { "Population", "194.347" }, { "Rate", "0.0419" }, { "uid", 15 } },
        new Dictionary<string, object>() { { "Year", "1966" }, { "HPI", "106.6787192" }, { "BuildCost", "76.74926786" }, { "Population", "196.599" }, { "Rate", "0.0461" }, { "uid", 16 } },
        new Dictionary<string, object>() { { "Year", "1967" }, { "HPI", "106.3897611" }, { "BuildCost", "77.15051023" }, { "Population", "198.752" }, { "Rate", "0.0458" }, { "uid", 17 } },
        new Dictionary<string, object>() { { "Year", "1968" }, { "HPI", "105.2152935" }, { "BuildCost", "79.39056457" }, { "Population", "200.745" }, { "Rate", "0.0553" }, { "uid", 18 } },
        new Dictionary<string, object>() { { "Year", "1969" }, { "HPI", "106.9530731" }, { "BuildCost", "83.32303834" }, { "Population", "202.736" }, { "Rate", "0.0604" }, { "uid", 19 } },
        new Dictionary<string, object>() { { "Year", "1970" }, { "HPI", "109.5578145" }, { "BuildCost", "83.04289525" }, { "Population", "205.089" }, { "Rate", "0.0779" }, { "uid", 20 } },
        new Dictionary<string, object>() { { "Year", "1971" }, { "HPI", "110.1900229" }, { "BuildCost", "89.43618588" }, { "Population", "207.692" }, { "Rate", "0.0624" }, { "uid", 21 } },
        new Dictionary<string, object>() { { "Year", "1972" }, { "HPI", "110.089853" }, { "BuildCost", "95.74309566" }, { "Population", "209.924" }, { "Rate", "0.0595" }, { "uid", 22 } },
        new Dictionary<string, object>() { { "Year", "1973" }, { "HPI", "105.0761478" }, { "BuildCost", "100.3045578" }, { "Population", "211.939" }, { "Rate", "0.0646" }, { "uid", 23 } },
        new Dictionary<string, object>() { { "Year", "1974" }, { "HPI", "102.5051836" }, { "BuildCost", "97.09327155" }, { "Population", "213.898" }, { "Rate", "0.0699" }, { "uid", 24 } },
        new Dictionary<string, object>() { { "Year", "1975" }, { "HPI", "103.454991" }, { "BuildCost", "94.12250092" }, { "Population", "215.981" }, { "Rate", "0.075" }, { "uid", 25 } },
        new Dictionary<string, object>() { { "Year", "1976" }, { "HPI", "105.5752263" }, { "BuildCost", "96.23389798" }, { "Population", "218.086" }, { "Rate", "0.0774" }, { "uid", 26 } },
        new Dictionary<string, object>() { { "Year", "1977" }, { "HPI", "113.3258904" }, { "BuildCost", "99.16550373" }, { "Population", "220.289" }, { "Rate", "0.0721" }, { "uid", 27 } },
        new Dictionary<string, object>() { { "Year", "1978" }, { "HPI", "118.3947307" }, { "BuildCost", "100.56884" }, { "Population", "222.629" }, { "Rate", "0.0796" }, { "uid", 28 } },
        new Dictionary<string, object>() { { "Year", "1979" }, { "HPI", "118.8156738" }, { "BuildCost", "100" }, { "Population", "225.106" }, { "Rate", "0.091" }, { "uid", 29 } },
        new Dictionary<string, object>() { { "Year", "1980" }, { "HPI", "112.3677501" }, { "BuildCost", "93.67720901" }, { "Population", "227.726" }, { "Rate", "0.108" }, { "uid", 30 } },
        new Dictionary<string, object>() { { "Year", "1981" }, { "HPI", "106.8724657" }, { "BuildCost", "90.5038767" }, { "Population", "230.008" }, { "Rate", "0.1257" }, { "uid", 31 } },
        new Dictionary<string, object>() { { "Year", "1982" }, { "HPI", "103.3129562" }, { "BuildCost", "88.95277083" }, { "Population", "232.218" }, { "Rate", "0.1459" }, { "uid", 32 } },
        new Dictionary<string, object>() { { "Year", "1983" }, { "HPI", "104.5574104" }, { "BuildCost", "91.52830102" }, { "Population", "234.333" }, { "Rate", "0.1046" }, { "uid", 33 } },
        new Dictionary<string, object>() { { "Year", "1984" }, { "HPI", "105.4357808" }, { "BuildCost", "89.06159549" }, { "Population", "236.394" }, { "Rate", "0.1167" }, { "uid", 34 } },
        new Dictionary<string, object>() { { "Year", "1985" }, { "HPI", "108.2776822" }, { "BuildCost", "86.30725178" }, { "Population", "238.506" }, { "Rate", "0.1138" }, { "uid", 35 } },
        new Dictionary<string, object>() { { "Year", "1986" }, { "HPI", "114.6429508" }, { "BuildCost", "85.06563926" }, { "Population", "240.683" }, { "Rate", "0.0919" }, { "uid", 36 } },
        new Dictionary<string, object>() { { "Year", "1987" }, { "HPI", "119.4622422" }, { "BuildCost", "85.80011747" }, { "Population", "242.843" }, { "Rate", "0.0708" }, { "uid", 37 } },
        new Dictionary<string, object>() { { "Year", "1988" }, { "HPI", "123.3192026" }, { "BuildCost", "84.31285438" }, { "Population", "245.061" }, { "Rate", "0.0867" }, { "uid", 38 } },
        new Dictionary<string, object>() { { "Year", "1989" }, { "HPI", "124.8941458" }, { "BuildCost", "81.66945023" }, { "Population", "247.387" }, { "Rate", "0.0909" }, { "uid", 39 } },
        new Dictionary<string, object>() { { "Year", "1990" }, { "HPI", "116.2873698" }, { "BuildCost", "79.63498843" }, { "Population", "250.181" }, { "Rate", "0.0821" }, { "uid", 40 } },
        new Dictionary<string, object>() { { "Year", "1991" }, { "HPI", "113.0775228" }, { "BuildCost", "76.74207454" }, { "Population", "253.53" }, { "Rate", "0.0809" }, { "uid", 41 } },
        new Dictionary<string, object>() { { "Year", "1992" }, { "HPI", "109.7008693" }, { "BuildCost", "77.05381963" }, { "Population", "256.922" }, { "Rate", "0.0703" }, { "uid", 42 } },
        new Dictionary<string, object>() { { "Year", "1993" }, { "HPI", "108.4357895" }, { "BuildCost", "78.88788054" }, { "Population", "260.282" }, { "Rate", "0.066" }, { "uid", 43 } },
        new Dictionary<string, object>() { { "Year", "1994" }, { "HPI", "108.4360571" }, { "BuildCost", "79.89887109" }, { "Population", "263.455" }, { "Rate", "0.0575" }, { "uid", 44 } },
        new Dictionary<string, object>() { { "Year", "1995" }, { "HPI", "107.6666232" }, { "BuildCost", "77.7443098" }, { "Population", "266.588" }, { "Rate", "0.0778" }, { "uid", 45 } },
        new Dictionary<string, object>() { { "Year", "1996" }, { "HPI", "106.7336444" }, { "BuildCost", "77.89285948" }, { "Population", "269.714" }, { "Rate", "0.0565" }, { "uid", 46 } },
        new Dictionary<string, object>() { { "Year", "1997" }, { "HPI", "109.216361" }, { "BuildCost", "79.39146429" }, { "Population", "272.958" }, { "Rate", "0.0658" }, { "uid", 47 } },
        new Dictionary<string, object>() { { "Year", "1998" }, { "HPI", "115.2452499" }, { "BuildCost", "78.79060549" }, { "Population", "276.154" }, { "Rate", "0.0554" }, { "uid", 48 } },
        new Dictionary<string, object>() { { "Year", "1999" }, { "HPI", "121.6232347" }, { "BuildCost", "78.98128131" }, { "Population", "279.328" }, { "Rate", "0.0472" }, { "uid", 49 } },
        new Dictionary<string, object>() { { "Year", "2000" }, { "HPI", "129.0640838" }, { "BuildCost", "78.72200105" }, { "Population", "282.158336" }, { "Rate", "0.0666" }, { "uid", 50 } },
        new Dictionary<string, object>() { { "Year", "2001" }, { "HPI", "136.1331884" }, { "BuildCost", "76.6401607" }, { "Population", "284.915024" }, { "Rate", "0.0516" }, { "uid", 51 } },
        new Dictionary<string, object>() { { "Year", "2002" }, { "HPI", "147.6076356" }, { "BuildCost", "76.8135395" }, { "Population", "287.501476" }, { "Rate", "0.0504" }, { "uid", 52 } },
        new Dictionary<string, object>() { { "Year", "2003" }, { "HPI", "160.0795509" }, { "BuildCost", "76.31543516" }, { "Population", "289.985771" }, { "Rate", "0.0405" }, { "uid", 53 } },
        new Dictionary<string, object>() { { "Year", "2004" }, { "HPI", "177.7766491" }, { "BuildCost", "80.77302579" }, { "Population", "292.805643" }, { "Rate", "0.0415" }, { "uid", 54 } },
        new Dictionary<string, object>() { { "Year", "2005" }, { "HPI", "195.3510726" }, { "BuildCost", "82.79484772" }, { "Population", "295.583436" }, { "Rate", "0.0422" }, { "uid", 55 } },
        new Dictionary<string, object>() { { "Year", "2006" }, { "HPI", "192.2875379" }, { "BuildCost", "82.72701137" }, { "Population", "298.44242" }, { "Rate", "0.0442" }, { "uid", 56 } },
        new Dictionary<string, object>() { { "Year", "2007" }, { "HPI", "170.090729" }, { "BuildCost", "83.19660676" }, { "Population", "301.279593" }, { "Rate", "0.0476" }, { "uid", 57 } },
        new Dictionary<string, object>() { { "Year", "2008" }, { "HPI", "133.9747086" }, { "BuildCost", "83.4461592" }, { "Population", "304.228257" }, { "Rate", "0.0374" }, { "uid", 58 } },
        new Dictionary<string, object>() { { "Year", "2009" }, { "HPI", "130.9370732" }, { "BuildCost", "84.80835495" }, { "Population", "307.212123" }, { "Rate", "0.0252" }, { "uid", 59 } },
        new Dictionary<string, object>() { { "Year", "2010" }, { "HPI", "124.585809" }, { "BuildCost", "84.18072431" }, { "Population", "310.232863" }, { "Rate", "0.0373" }, { "uid", 60 } },
        new Dictionary<string, object>() { { "Year", "2011" }, { "HPI", "120.083801" }, { "BuildCost", "84.18072431" }, { "Population", "312.8936" }, { "Rate", "0.0339" }, { "uid", 61 } },
        new Dictionary<string, object>() { { "Year", "2012" }, { "HPI", "123.9370732" }, { "BuildCost", "84.80835495" }, { "Population", "307.212123" }, { "Rate", "0.0252" }, { "uid", 62 } },
        new Dictionary<string, object>() { { "Year", "2013" }, { "HPI", "131.585809" }, { "BuildCost", "84.18072431" }, { "Population", "310.232863" }, { "Rate", "0.0373" }, { "uid", 63 } },
        new Dictionary<string, object>() { { "Year", "2014" }, { "HPI", "134.083801" }, { "BuildCost", "84.18072431" }, { "Population", "312.8936" }, { "Rate", "0.0339" }, { "uid", 64 } },
        new Dictionary<string, object>() { { "Year", "2015" }, { "HPI", "136.083801" }, { "BuildCost", "84.18072431" }, { "Population", "311.8936" }, { "Rate", "0.0342" }, { "uid", 65 } },
        new Dictionary<string, object>() { { "Year", "2016" }, { "HPI", "138.083801" }, { "BuildCost", "84.18072431" }, { "Population", "310.8936" }, { "Rate", "0.0346" }, { "uid", 66 } },
        new Dictionary<string, object>() { { "Year", "2017" }, { "HPI", "142.083801" }, { "BuildCost", "84.18072431" }, { "Population", "313.8936" }, { "Rate", "0.0374" }, { "uid", 67 } }
    };

    ChartXAxis xAxis = new ChartXAxis()
    {
        DataField = "Year",
        UnitInterval = 10,
        MaxValue = 2010,
        ValuesOnTicks = true,
        Labels = new ChartLabels() { AutoRotate = true }
    };

    List<ChartSeriesGroup> seriesGroups = new List<ChartSeriesGroup>()
    {
        new ChartSeriesGroup()
        {
            Polar = true,
            Radius = 120,
            Type = ChartType.Splinearea,
            UseGradientColors = true,
            ValueAxis = new ChartValueAxis()
            {
                Labels = new ChartLabels()
                {
                    FormatSettings = new ChartFormatSettings()
                    {
                        DecimalPlaces = 0
                    },
                    AutoRotate = true
                }
            },
            Series = new List<ChartSeriesGroupSerie>()
            {
                new ChartSeriesGroupSerie()
                {
                    DataField = "HPI",
                    DisplayText = "Real Home Price Index",
                    Opacity = 0.7f,
                    LineWidth = 1,
                    Radius = 2
                },
                new ChartSeriesGroupSerie()
                {
                    DataField = "BuildCost",
                    DisplayText = "Building Cost Index",
                    Opacity = 0.7f,
                    LineWidth = 1,
                    Radius = 2
                }
            }
        }
    };
}
Result: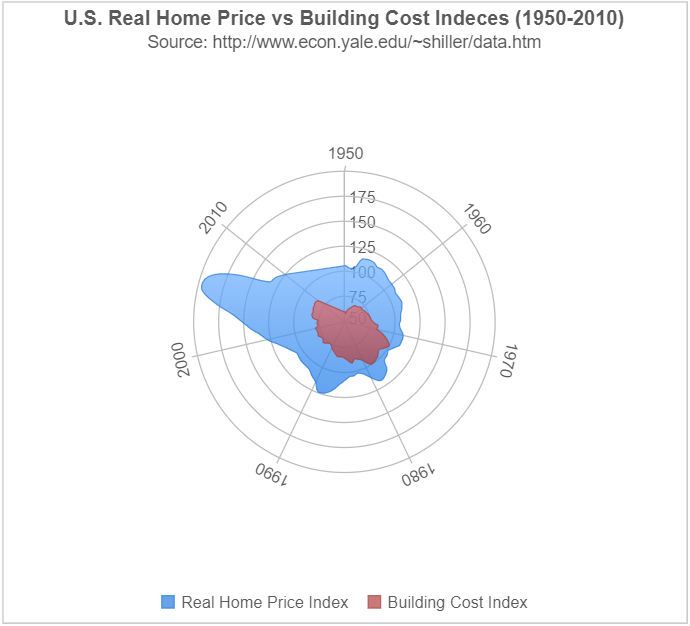
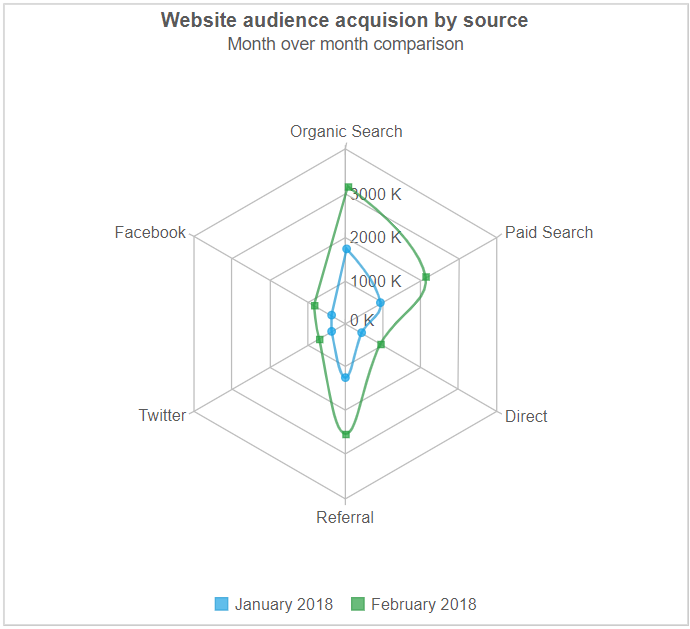
A is an example of a spider chart by setting Spider to
true to a series group:
    <Chart DataSource="sampleData" Caption="Website audience acquision by source" Description="Month over month comparison" Animation="Animation.None"
           ShowLegend Padding="new Padding() { Left = 5, Top = 5, Right = 5, Bottom = 5 }" TitlePadding="new Padding() { Left = 0, Top = 0, Right = 0, Bottom = 5 }"
           ColorScheme="ChartColorScheme.Scheme05" XAxis="xAxis" ValueAxis="valueAxis" SeriesGroups="seriesGroups" />

@code {

    static List<Dictionary<string, object>> sampleData = new List<Dictionary<string, object>>()
    {
        new Dictionary<string, object> { { "type", "Organic Search" }, { "month1", 1725090 }, { "month2", 3136190 } },
        new Dictionary<string, object> { { "type", "Paid Search" }, { "month1", 925090 }, { "month2", 2136190 } },
        new Dictionary<string, object> { { "type", "Direct" }, { "month1", 425090 }, { "month2", 936190 } },
        new Dictionary<string, object> { { "type", "Referral" }, { "month1", 1250900 }, { "month2", 2536190 } },
        new Dictionary<string, object> { { "type", "Twitter" }, { "month1", 350900 }, { "month2", 681900 } },
        new Dictionary<string, object> { { "type", "Facebook" }, { "month1", 381900 }, { "month2", 831500 } }
    };

    ChartXAxis xAxis = new ChartXAxis()
    {
        DataField = "type",
        DisplayText = "Traffic source",
        ValuesOnTicks = true,
        Labels = new ChartLabels() { AutoRotate = false }
    };

    ChartValueAxis valueAxis = new ChartValueAxis()
    {
        UnitInterval = 1000000,
        Labels = new ChartLabels()
        {
            FormatSettings = new ChartFormatSettings()
            {
                DecimalPlaces = 0
            }
        }
    };

    List<ChartSeriesGroup> seriesGroups = new List<ChartSeriesGroup>()
    {
        new ChartSeriesGroup()
        {
            Spider = true,
            StartAngle = 0,
            EndAngle = 360,
            Radius = 120,
            Type = ChartType.Spline,
            Series = new List<ChartSeriesGroupSerie>()
            {
                new ChartSeriesGroupSerie()
                {
                    DataField = "month1",
                    DisplayText = "January 2018",
                    Opacity = 0.7f,
                    Radius = 2,
                    LineWidth = 2,
                    SymbolType = ChartSymbolType.Circle
                },
                new ChartSeriesGroupSerie()
                {
                    DataField = "month2",
                    DisplayText = "February 2018",
                    Opacity = 0.7f,
                    Radius = 2,
                    LineWidth = 2,
                    SymbolType = ChartSymbolType.Square
                }
            }
        }
    };
}
Result: