Smart.Chart Axes
Setup The Blazor Application
Follow the Getting Started guide to set up your Blazor Application with Smart UI.
Setup the Blazor Smart.Chart
Follow the Get Started with Smart.Chart guide to set up the component.
XAxis and ValueAxis
Smart.Chart has two main types of axes - ValueAxis and XAxis. Typically the ValueAxis represents the vertical axis in the chart although you may choose to rotate the axes and in this case the ValueAxis will be displayed horizontally.
The following image illustrates the different elements of the axes:
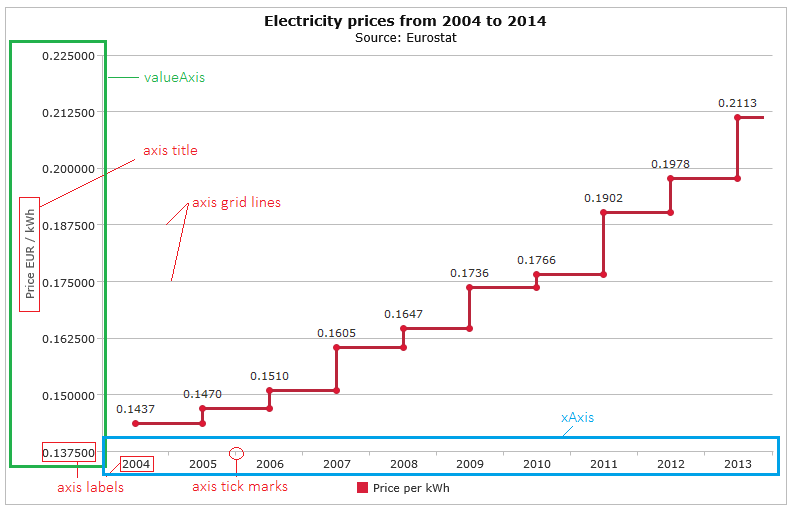
You can read in details about the common axis properties as well as XAxis-specific and ValueAxis-specific properties in our Chart Axes Docs Page.
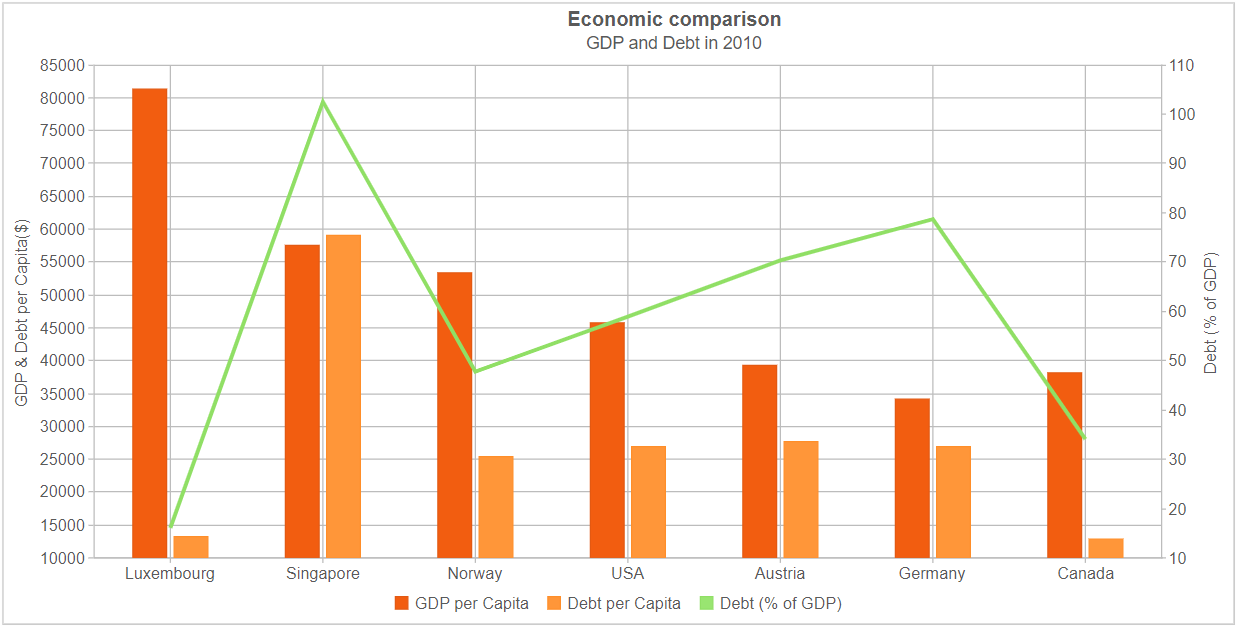
Multiple Horizontal and/or Vertical axes
Multiple XAxis and ValueAxis instances can be plotted on the same Chart by adding multiple series groups with their own XAxis and ValueAxis settings.
Here is an example with multiple value axes:
<Chart @ref="chart" DataSource="sampleData" Caption="Economic comparison" Description="GDP and Debt in 2010" ShowLegend
           Padding="new Padding() { Left = 5, Top = 5, Right = 5, Bottom = 5 }" TitlePadding="new Padding() { Left = 90, Top = 0, Right = 0, Bottom = 10 }"
           ColorScheme="ChartColorScheme.Scheme32" XAxis="xAxis" SeriesGroups="seriesGroups" />

@code {
    Chart chart;
    CheckBox landscape;

    List<Dictionary<string, object>> sampleData = new List<Dictionary<string, object>>()
    {
        new Dictionary<string, object> { { "Country", "Luxembourg" }, { "GDP", 81278.63 }, { "DebtPercent", 16.2 }, { "Debt", 13167.13806 }, { "uid", 0 } },
        new Dictionary<string, object> { { "Country", "Singapore" }, { "GDP", 57596.47 }, { "DebtPercent", 102.4 }, { "Debt", 58978.78528 }, { "uid", 1 } },
        new Dictionary<string, object> { { "Country", "Norway" }, { "GDP", 53285.21 }, { "DebtPercent", 47.7 }, { "Debt", 25417.04517 }, { "uid", 2 } },
        new Dictionary<string, object> { { "Country", "USA" }, { "GDP", 45759.46 }, { "DebtPercent", 58.9 }, { "Debt", 26952.32194 }, { "uid", 3 } },
        new Dictionary<string, object> { { "Country", "Austria" }, { "GDP", 39269.33 }, { "DebtPercent", 70.4 }, { "Debt", 27645.60832 }, { "uid", 4 } },
        new Dictionary<string, object> { { "Country", "Germany" }, { "GDP", 34065.12 }, { "DebtPercent", 78.8 }, { "Debt", 26843.31456 }, { "uid", 5 } },
        new Dictionary<string, object> { { "Country", "Canada" }, { "GDP", 38065.13 }, { "DebtPercent", 34 }, { "Debt", 12942.1442 }, { "uid", 6 } }
    };

    ChartXAxis xAxis = new ChartXAxis()
    {
        DataField = "Country"
    };

    List<ChartSeriesGroup> seriesGroups = new List<ChartSeriesGroup>()
    {
        new ChartSeriesGroup()
        {
            Type = ChartType.Column,
            ColumnsGapPercent = 50,
            ValueAxis = new ChartValueAxis()
            {
                UnitInterval = 5000,
                Title = new ChartTitle() { Text = "GDP & Debt per Capita($)<br>" }
            },
            Series = new List<ChartSeriesGroupSerie>()
            {
                new ChartSeriesGroupSerie() { DataField = "GDP", DisplayText = "GDP per Capita" },
                new ChartSeriesGroupSerie() { DataField = "Dept", DisplayText = "Dept per Capita" }
            }
        },
        new ChartSeriesGroup()
        {
            Type = ChartType.Line,
            ValueAxis = new ChartValueAxis()
            {
                UnitInterval = 10,
                Title = new ChartTitle() { Text = "Debt (% of GDP)<br>" },
                Position = AxisPosition.Right,
                GridLines = new ChartLines() { Visible = false }
            },
            Series = new List<ChartSeriesGroupSerie>()
            {
                new ChartSeriesGroupSerie() { DataField = "DebtPercent", DisplayText = "Debt (% of GDP)" }
            }
        }
    };
}
Result: