Getting Started with GanttChart Web Component
Smart UI Web Components work with current evergreen browsers and Node 18+ for local tooling; pin package versions to match your project policy.
Smart UI is distributed as the smart-webcomponents NPM package. You can also use the full download from the Download page.
Quick start
- Install the package:
npm install smart-webcomponents
- Load the GanttChart module (ES module script):
<script type="module" src="node_modules/smart-webcomponents/source/modules/smart.ganttchart.js"></script>
- Add the default stylesheet (prefer angular.json / bundler entry in app codebases; for plain HTML use a link):
<link rel="stylesheet" type="text/css" href="node_modules/smart-webcomponents/source/styles/smart.default.css" />
- Add markup in one of two ways - semantic custom element (the component tag is in your HTML) or a host
div(you mount programmatically with appendTo):
Semantic element (id matches the selector in Smart()):
<smart-gantt-chart id="ganttchart"></smart-gantt-chart>
Host container (id matches appendTo on Smart.GanttChart):
<div id="ganttchartContainer"></div>
- Initialize after the module loads: define a const ganttchartOptions object, then either bind with Smart('#ganttchart', ...) on the semantic tag or use new Smart.GanttChart({ ...ganttchartOptions, appendTo: '#ganttchartContainer' }) on the host
div:
<script type="module">
	import 'node_modules/smart-webcomponents/source/modules/smart.ganttchart.js';

	const ganttchartOptions = {
				treeSize: '30%',
				durationUnit: 'hour',
				taskColumns: [
					{
						label: 'Tasks',
						value: 'label',
						size: '60%'
					},
					{
						label: 'Duration (hours)',
						value: 'duration'
					}
				],
				dataSource: [
					{
						label: 'PRD & User-Stories',
						dateStart: '2026-01-10',
						dateEnd: '2026-03-10',
						class: 'product-team',
						type: 'task'
					},
					{
						label: 'Persona & Journey',
						dateStart: '2026-03-01',
						dateEnd: '2026-04-30',
						class: 'marketing-team',
						type: 'task'
					},
					{
						label: 'Architecture',
						dateStart: '2026-04-11',
						dateEnd: '2026-05-16',
						class: 'product-team',
						type: 'task'
					},
					{
						label: 'Prototyping',
						dateStart: '2026-05-17',
						dateEnd: '2026-07-01',
						class: 'dev-team',
						type: 'task'
					},
					{
						label: 'Design',
						dateStart: '2026-07-02',
						dateEnd: '2026-08-01',
						class: 'design-team',
						type: 'task'
					},
					{
						label: 'Development',
						dateStart: '2026-08-01',
						dateEnd: '2026-09-10',
						class: 'dev-team',
						type: 'task'
					},
					{
						label: 'Testing & QA',
						dateStart: '2026-09-11',
						dateEnd: '2026-10-10',
						class: 'qa-team',
						type: 'task'
					},
					{
						label: 'UAT Test',
						dateStart: '2026-10-12',
						dateEnd: '2026-11-11',
						class: 'product-team',
						type: 'task'
					},
					{
						label: 'Handover & Documentation',
						dateStart: '2026-10-17',
						dateEnd: '2026-11-31',
						class: 'marketing-team',
						type: 'task'
					},
					{
						label: 'Release',
						dateStart: '2026-11-01',
						dateEnd: '2026-12-31',
						class: 'release-team',
						type: 'task'
					}
				]
			};

	// Option A - semantic <smart-gantt-chart> with id="ganttchart"
	Smart('#ganttchart', class {
		get properties() {
			return ganttchartOptions;
		}
	});

	// Option B - host div id="ganttchartContainer"
	// const ganttchartInstance = new Smart.GanttChart({
	// 	...ganttchartOptions,
	// 	appendTo: '#ganttchartContainer'
	// });

	// Option C - constructor(selector, options), then append the returned element yourself
	// const myGanttChart = new Smart.GanttChart('#ganttchart', ganttchartOptions);
	// document.body.appendChild(myGanttChart);
</script>
Uncomment Option B when you use the host
div; use Option A when you use the semantic element. The Runtime cookbook also documents new Smart.GanttChart('#ganttchart', ganttchartOptions) with appendChild, and document.createElement('smart-gantt-chart') with .props or Object.assign (all are valid patterns; do not combine overlapping patterns for the same instance unless you intend multiple components). - Serve the folder over HTTP (or use your bundler dev server) and open the page.
Runtime cookbook
Alternative creation patterns and imperative APIs. These are all valid ways to create Smart UI components: semantic markup + Smart(); new Smart.GanttChart({ ...options, appendTo: '#...' }); new Smart.GanttChart('#ganttchart', options) plus appendChild on the returned element; and document.createElement('smart-gantt-chart') then assigning options via .props (Grid and other Smart UI tags) or Object.assign on the element.
Constructor with a selector string and options, then append the returned element (for example const myGrid = new Smart.Grid('#grid', gridOptions)):
	const ganttchartOptions = {
				treeSize: '30%',
				durationUnit: 'hour',
				taskColumns: [
					{
						label: 'Tasks',
						value: 'label',
						size: '60%'
					},
					{
						label: 'Duration (hours)',
						value: 'duration'
					}
				],
				dataSource: [
					{
						label: 'PRD & User-Stories',
						dateStart: '2026-01-10',
						dateEnd: '2026-03-10',
						class: 'product-team',
						type: 'task'
					},
					{
						label: 'Persona & Journey',
						dateStart: '2026-03-01',
						dateEnd: '2026-04-30',
						class: 'marketing-team',
						type: 'task'
					},
					{
						label: 'Architecture',
						dateStart: '2026-04-11',
						dateEnd: '2026-05-16',
						class: 'product-team',
						type: 'task'
					},
					{
						label: 'Prototyping',
						dateStart: '2026-05-17',
						dateEnd: '2026-07-01',
						class: 'dev-team',
						type: 'task'
					},
					{
						label: 'Design',
						dateStart: '2026-07-02',
						dateEnd: '2026-08-01',
						class: 'design-team',
						type: 'task'
					},
					{
						label: 'Development',
						dateStart: '2026-08-01',
						dateEnd: '2026-09-10',
						class: 'dev-team',
						type: 'task'
					},
					{
						label: 'Testing & QA',
						dateStart: '2026-09-11',
						dateEnd: '2026-10-10',
						class: 'qa-team',
						type: 'task'
					},
					{
						label: 'UAT Test',
						dateStart: '2026-10-12',
						dateEnd: '2026-11-11',
						class: 'product-team',
						type: 'task'
					},
					{
						label: 'Handover & Documentation',
						dateStart: '2026-10-17',
						dateEnd: '2026-11-31',
						class: 'marketing-team',
						type: 'task'
					},
					{
						label: 'Release',
						dateStart: '2026-11-01',
						dateEnd: '2026-12-31',
						class: 'release-team',
						type: 'task'
					}
				]
			};
	const myGanttChart = new Smart.GanttChart('#ganttchart', ganttchartOptions);
	document.body.appendChild(myGanttChart);
Create with document.createElement('smart-gantt-chart'), assign properties (same as any custom element), then append:
	const ganttchartOptions = {
				treeSize: '30%',
				durationUnit: 'hour',
				taskColumns: [
					{
						label: 'Tasks',
						value: 'label',
						size: '60%'
					},
					{
						label: 'Duration (hours)',
						value: 'duration'
					}
				],
				dataSource: [
					{
						label: 'PRD & User-Stories',
						dateStart: '2026-01-10',
						dateEnd: '2026-03-10',
						class: 'product-team',
						type: 'task'
					},
					{
						label: 'Persona & Journey',
						dateStart: '2026-03-01',
						dateEnd: '2026-04-30',
						class: 'marketing-team',
						type: 'task'
					},
					{
						label: 'Architecture',
						dateStart: '2026-04-11',
						dateEnd: '2026-05-16',
						class: 'product-team',
						type: 'task'
					},
					{
						label: 'Prototyping',
						dateStart: '2026-05-17',
						dateEnd: '2026-07-01',
						class: 'dev-team',
						type: 'task'
					},
					{
						label: 'Design',
						dateStart: '2026-07-02',
						dateEnd: '2026-08-01',
						class: 'design-team',
						type: 'task'
					},
					{
						label: 'Development',
						dateStart: '2026-08-01',
						dateEnd: '2026-09-10',
						class: 'dev-team',
						type: 'task'
					},
					{
						label: 'Testing & QA',
						dateStart: '2026-09-11',
						dateEnd: '2026-10-10',
						class: 'qa-team',
						type: 'task'
					},
					{
						label: 'UAT Test',
						dateStart: '2026-10-12',
						dateEnd: '2026-11-11',
						class: 'product-team',
						type: 'task'
					},
					{
						label: 'Handover & Documentation',
						dateStart: '2026-10-17',
						dateEnd: '2026-11-31',
						class: 'marketing-team',
						type: 'task'
					},
					{
						label: 'Release',
						dateStart: '2026-11-01',
						dateEnd: '2026-12-31',
						class: 'release-team',
						type: 'task'
					}
				]
			};
	const ganttchart = document.createElement('smart-gantt-chart');
	Object.assign(ganttchart, ganttchartOptions);
	document.body.appendChild(ganttchart);
Host on a div with appendTo (import the module, then instantiate when the document is ready; the container id must match appendTo):
	import "../../source/modules/smart.ganttchart.js";

	document.readyState === 'complete' ? init() : window.addEventListener('load', init);

	function init() {
		const ganttchartOptions = {
				treeSize: '30%',
				durationUnit: 'hour',
				taskColumns: [
					{
						label: 'Tasks',
						value: 'label',
						size: '60%'
					},
					{
						label: 'Duration (hours)',
						value: 'duration'
					}
				],
				dataSource: [
					{
						label: 'PRD & User-Stories',
						dateStart: '2026-01-10',
						dateEnd: '2026-03-10',
						class: 'product-team',
						type: 'task'
					},
					{
						label: 'Persona & Journey',
						dateStart: '2026-03-01',
						dateEnd: '2026-04-30',
						class: 'marketing-team',
						type: 'task'
					},
					{
						label: 'Architecture',
						dateStart: '2026-04-11',
						dateEnd: '2026-05-16',
						class: 'product-team',
						type: 'task'
					},
					{
						label: 'Prototyping',
						dateStart: '2026-05-17',
						dateEnd: '2026-07-01',
						class: 'dev-team',
						type: 'task'
					},
					{
						label: 'Design',
						dateStart: '2026-07-02',
						dateEnd: '2026-08-01',
						class: 'design-team',
						type: 'task'
					},
					{
						label: 'Development',
						dateStart: '2026-08-01',
						dateEnd: '2026-09-10',
						class: 'dev-team',
						type: 'task'
					},
					{
						label: 'Testing & QA',
						dateStart: '2026-09-11',
						dateEnd: '2026-10-10',
						class: 'qa-team',
						type: 'task'
					},
					{
						label: 'UAT Test',
						dateStart: '2026-10-12',
						dateEnd: '2026-11-11',
						class: 'product-team',
						type: 'task'
					},
					{
						label: 'Handover & Documentation',
						dateStart: '2026-10-17',
						dateEnd: '2026-11-31',
						class: 'marketing-team',
						type: 'task'
					},
					{
						label: 'Release',
						dateStart: '2026-11-01',
						dateEnd: '2026-12-31',
						class: 'release-team',
						type: 'task'
					}
				]
			};
		const ganttchart = new Smart.GanttChart({
			...ganttchartOptions,
			appendTo: '#ganttchartContainer'
		});
	}
Append to the DOM:
const container = document.getElementById('ganttchart-container');
container.appendChild(ganttchart);
Remove from the DOM:
ganttchart.remove();
Set a property:
ganttchart.disabled = true;
ganttchart.theme = 'dark';
Get a property value:
const isDisabled = ganttchart.disabled;
const currentTheme = ganttchart.theme;
Invoke a method:
ganttchart.refresh();
ganttchart.focus();
Add event listener:
ganttchart.addEventListener('change', (event) => {
    const { value, oldValue } = event.detail;
    console.log(`Value changed from ${oldValue} to ${value}`);
});
Remove event listener:
const handleChange = (event) => {
    console.log('Changed:', event.detail);
};

ganttchart.addEventListener('change', handleChange);
ganttchart.removeEventListener('change', handleChange);
Define a dataSource
In order to create a project schedule the user first has to define a dataSource. The dataSource should be an Array of objects describing the tasks and their connections. There are three types of tasks:
-
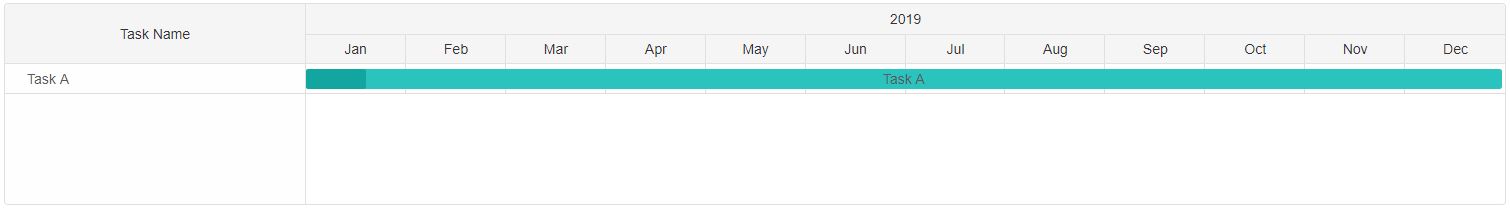
Tasks - a task represent a single operation.
Let's take a closer look at a task's definition:
    const item = {
                   type: 'task',
                   label: 'Task A',
                   dateStart: '2026-1-1',
                   dateEnd: '2026-12-31',
                   progress: 5
                };
The following task definition will create a task that starts on 1st January 2024 and ends on 31st January 2024. It has a label "Task A" that is visible in the Task Tree and the Timeline. The type determines the type of the task. Progress property shows what the current status of the task is.
Here's how to create a GanttChart with a single Task:
<!DOCTYPE html>
<html>
<head>
 <link rel="stylesheet" href=../../source/styles/smart.default.css" type="text/css" />
 <script type="text/javascript" src="../../source/modules/smart.ganttchart.js"></script>

<script>
    window.onload = function() {
    const ganttChart = document.querySelector('smart-gantt-chart');

    ganttChart.dataSource = [
                {
                   type: 'task',
                   label: 'Task A',
                   dateStart: '2026-1-1',
                   dateEnd: '2026-12-31',
                   progress: 5
                }]
    }
</script>
</head>
<body>
    <smart-gantt-chart></smart-gantt-chart>
</body>
</html>
Demo
-
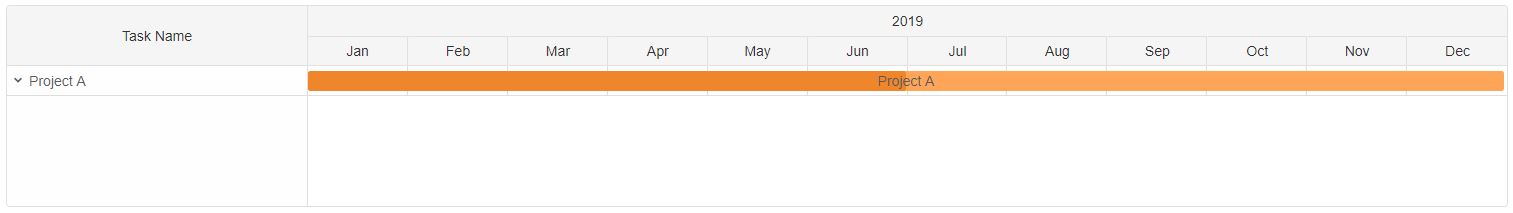
Project - a project is a Task group that can have sub-tasks. Although it can exist on it's own as a task.
Let's take a closer look at a task's definition:
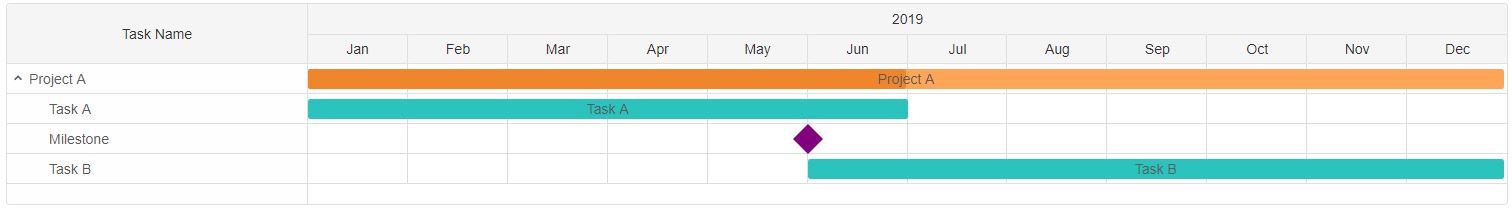
    const project = {
                    type: 'project',
                    label: 'Project A',
                    dateStart: '2026-1-1',
                    dateEnd: '2026-12-31',
                    progress: 50,
                    tasks: [
                        {
                            type: 'task',
                            label: 'Task A',
                            dateStart: '2026-1-1',
                            dateEnd: '2026-6-31'
                        },
                        {
                            type: 'task',
                            label: 'Task B',
                            dateStart: '2026-6-1',
                            dateEnd: '2026-12-31'
                        }]

                };
The following project definition will create a Project Task labeled 'Project A' with two sub-tasks: 'Task A' and 'Task B'. This gives a total of 3 tasks. The tasks attribute is used to define sub-tasks for a Project. By default Project tasks are not expanded. Pressing on the arrow icon infront of the task inside the Task Tree or calling the expand method will expand the task and reveal it's sub tasks.
Here's how to create a GanttChart with a Project that has two sub-tasks:
<!DOCTYPE html>
<html>
<head>
 <link rel="stylesheet" href=../../source/styles/smart.default.css" type="text/css" />
 <script type="text/javascript" src="../../source/modules/smart.ganttchart.js"></script>

<script>
    window.onload = function() {
    const ganttChart = document.querySelector('smart-gantt-chart');

    ganttChart.dataSource = [
                  {
                    type: 'project',
                    label: 'Project A',
                    dateStart: '2026-1-1',
                    dateEnd: '2026-12-31',
                    progress: 50,
                    tasks: [
                        {
                            type: 'task',
                            label: 'Task A',
                            dateStart: '2026-1-1',
                            dateEnd: '2026-6-31'
                        },
                        {
                            type: 'task',
                            label: 'Task B',
                            dateStart: '2026-6-1',
                            dateEnd: '2026-12-31'
                        }]

                }]
    }
</script>
</head>
<body>
    <smart-gantt-chart></smart-gantt-chart>
</body>
</html>
Demo
And here's how to create an expanded Project:
<!DOCTYPE html>
<html>
<head>
 <link rel="stylesheet" href=../../source/styles/smart.default.css" type="text/css" />
 <script type="text/javascript" src="../../source/modules/smart.ganttchart.js"></script>

<script>
    window.onload = function() {
    const ganttChart = document.querySelector('smart-gantt-chart');

    ganttChart.dataSource = [
                  {
                    type: 'project',
                    label: 'Project A',
                    dateStart: '2026-1-1',
                    dateEnd: '2026-12-31',
                    progress: 50,
                    expanded: true,
                    tasks: [
                        {
                            type: 'task',
                            label: 'Task A',
                            dateStart: '2026-1-1',
                            dateEnd: '2026-6-31'
                        },
                        {
                            type: 'task',
                            label: 'Task B',
                            dateStart: '2026-6-1',
                            dateEnd: '2026-12-31'
                        }]

                }]
    }
</script>
</head>
<body>
    <smart-gantt-chart></smart-gantt-chart>
</body>
</html>
Demo
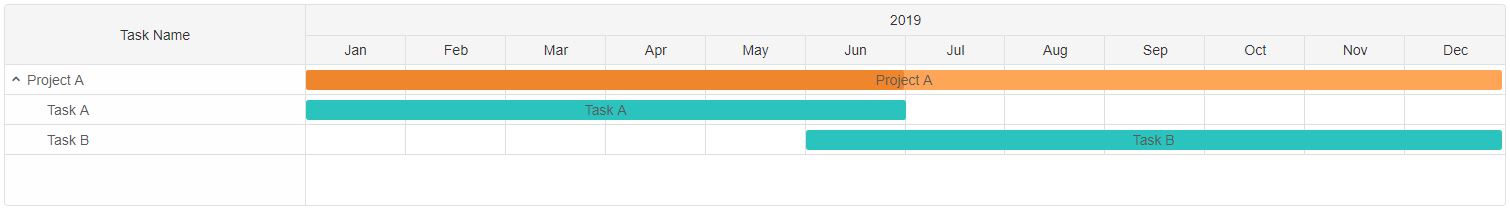
expanded attribute determines if the Project task is expanded or not.
-
Milestone - is a task that doesn't have a duration. It's dateStart/dateEnd are the same. It's used to mark the end or a breakpoint of a Project. Milestone do not have progress nor sub-tasks. However they can be defined as a sub-task of a Project. Milestones are different in shape inside the Timeline to visually differentiate from the rest.
Here's how to define a milestone:
    const milestone = {
                    type: 'milestone',
                    label: 'Milestone A',
                    dateStart: '2026-6-1'
                   };
The following task definition will create a milestone.
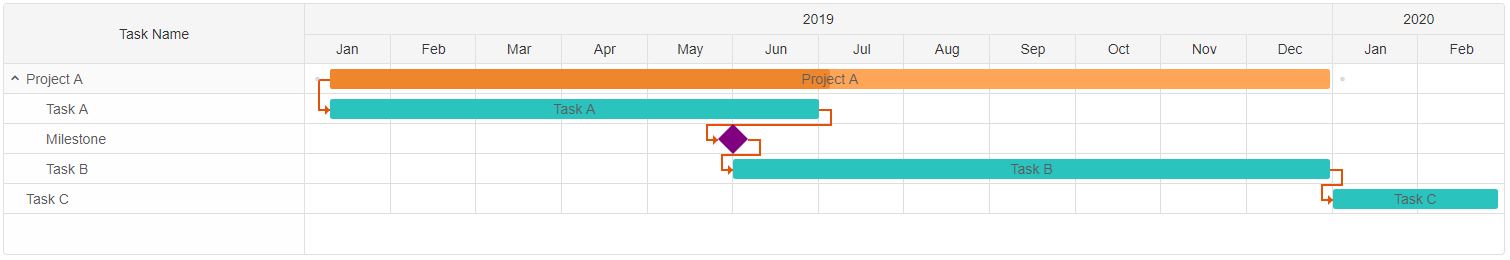
Here's how to create a Project with two tasks and a milestone:
<!DOCTYPE html>
<html>
<head>
 <link rel="stylesheet" href=../../source/styles/smart.default.css" type="text/css" />
 <script type="text/javascript" src="../../source/modules/smart.ganttchart.js"></script>

<script>
    window.onload = function() {
    const ganttChart = document.querySelector('smart-gantt-chart');

    ganttChart.dataSource = [
                  {
                    type: 'project',
                    label: 'Project A',
                    dateStart: '2026-1-1',
                    dateEnd: '2026-12-31',
                    expanded: true,
                    progress: 50,
                    tasks: [
                        {
                            type: 'task',
                            label: 'Task A',
                            dateStart: '2026-1-1',
                            dateEnd: '2026-6-31'
                        },
                        {
                            type: 'milestone',
                            label: 'Milestone',
                            dateStart: '2026-6-1'
                        },
                        {
                            type: 'task',
                            label: 'Task B',
                            dateStart: '2026-6-1',
                            dateEnd: '2026-12-31'
                        }]

                }]
    }
</script>
</head>
<body>
    <smart-gantt-chart></smart-gantt-chart>
</body>
</html>
Demo
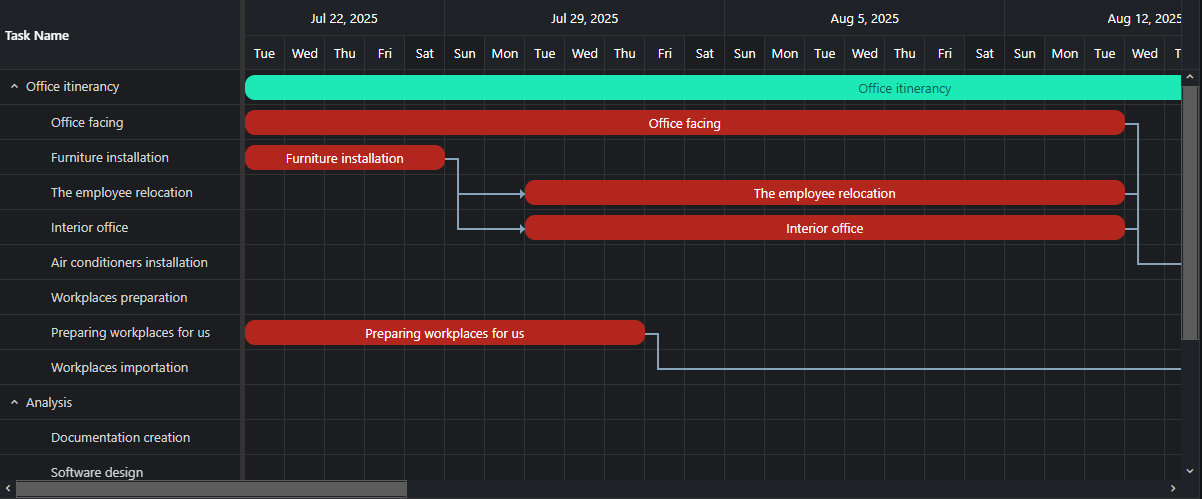
Task Connections
Task Connections describe the relations between the tasks. Each task has an connections attribute that is used to which tasks to connect to. Connections attribute is applicable to all types of tasks. However there are several restrictions when it comes to task connections:
- Only one connection can exist between two tasks - if a connection exists between two tasks and the user creates a new one, the previous is deleted.
- Looping connections when autoSchedule is enabled are not allowed - when autoSchedule is enabled the tasks are repositioned depending on the connections. Tasks connected in a loop are not allowed becase they can't exist meaningfully inside the timeline.
Connections show which tasks start/end after another. This gives the possibility to automate the planning process.
Connections are defined as an Array of Objects. Each object represents a connection that has two attributes:
- target - the index of the target Task that the current task will connect to.
-
type - the type of connection. There are four types of connections:
- Start-to-Start - connects the start of one task to the start of another. The target task can't start until the start task begins.
- Start-to-End - connects the start of one task to the end of another. This means that the target task can't end before the start task is begins.
- End-to-Start - connects the end of one task to the start of another. This means that the target task can't start before the start task is finished.
- End-to-End - connects the end of one task to the end of another.This means that the target task can't end before the start task is finished.
Here's how the definition of a Project with connected tasks looks:
    const project = {
                    type: 'project',
                    label: 'Project A',
                    dateStart: '2026-1-1',
                    dateEnd: '2026-12-31',
                    progress: 50,
                    connections: [
                        {
                            target: 1,
                            type: 2
                        }
                    ],
                    tasks: [
                        {
                            type: 'task',
                            label: 'Task A',
                            dateStart: '2026-1-1',
                            dateEnd: '2026-6-31',
                            connections: [
                                {
                                    target: 2,
                                    type: 0
                                }
                            ]
                        },
                        {
                            type: 'task',
                            label: 'Task B',
                            dateStart: '2026-6-1',
                            dateEnd: '2026-12-31'
                        }]
                };
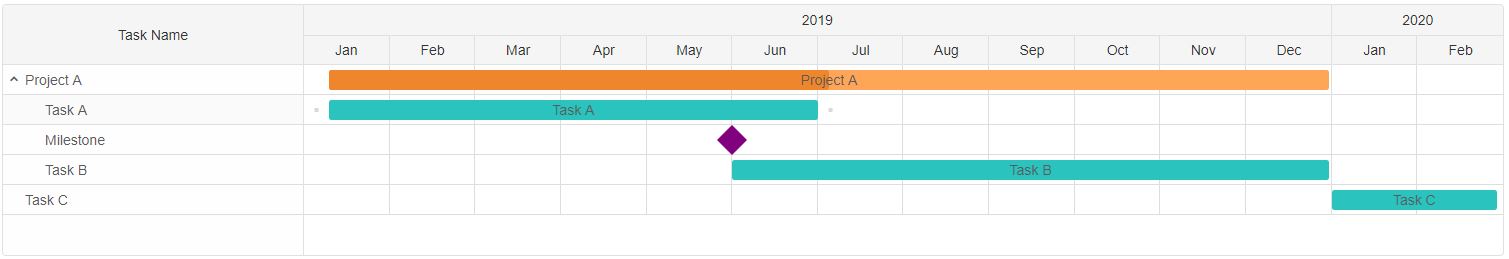
Here's how to craete a connected tasks Timeline:
<!DOCTYPE html>
<html>
<head>
 <link rel="stylesheet" href=../../source/styles/smart.default.css" type="text/css" />
 <script type="text/javascript" src="../../source/modules/smart.ganttchart.js"></script>
<script>
    window.onload = function() {
    const ganttChart = document.querySelector('smart-gantt-chart');

    ganttChart.dataSource = [
                {
                    type: 'project',
                    label: 'Project A',
                    dateStart: '2026-1-10',
                    dateEnd: '2026-12-31',
                    progress: 50,
                    expanded: true,
                    connections: [
                        {
                            target: 1,
                            type: 0
                        }
                    ],
                    tasks: [
                        {
                            type: 'task',
                            label: 'Task A',
                            dateStart: '2026-1-10',
                            dateEnd: '2026-6-31',
                            connections: [
                                {
                                    target: 2,
                                    type: 1
                                }
                            ]
                        },
                         {
                            type: 'milestone',
                            label: 'Milestone',
                            dateStart: '2026-6-1',
                            connections: [
                                {
                                    target: 3,
                                    type: 1
                                }
                            ]
                        },
                        {
                            type: 'task',
                            label: 'Task B',
                            dateStart: '2026-6-1',
                            dateEnd: '2026-12-31',
                            connections: [
                                {
                                    target: 4,
                                    type: 1
                                }
                             ]
                        }]
                },
                {
                    type: 'task',
                    label: 'Task C',
                    dateStart: '2026-1-1',
                    dateEnd: '2026-02-28'
                }
                ]
    }
</script>
</head>
<body>
    <smart-gantt-chart></smart-gantt-chart>
</body>
</html>
Demo
Task connections can be created/delete via the API methods as well:
- createConnection - Creates a connection between two tasks.
- removeConnection - Removes a specific connection by targetIndex, sourceIndex and type of connection.
- removeTaskConnection - Removes connections of a task or connections between the source task and the target task. Depends on the arguments. The first arguments of the method indicates the source task. If the second argument is omitted the method will delete all connections of the source task. If not the connection between the source and target task will be removed. Used to delete a connection between tasks without knowing the type of the connection.
- removeAllConnections - Removes all connections between the tasks.
            const ganttChart = document.querySelector('smart-gantt-chart');

            //Creates three connections
            ganttChart.createConnection(0, 1, 0);
            ganttChart.createConnection(1, 2, 2);
            ganttChart.createConnection(1, 3, 0);
            ganttChart.createConnection(2, 3, 1);

            //Removes a specific connection
            ganttChart.removeConnection(0, 1, 0);

            //Removes the connection between Task 1 and 2
            ganttChart.removeTaskConnection(1, 2);

            //Removes all connections of Task 1
            ganttChart.removeTaskConnection(1);

            //Removes all Task connections
            ganttChart.removeAllConnections();
Demo
Editing
Tasks are defined via the dataSource property but can be updated via the API methods. DataSource can also be used to modify more settings and/or multiple tasks at once.
-
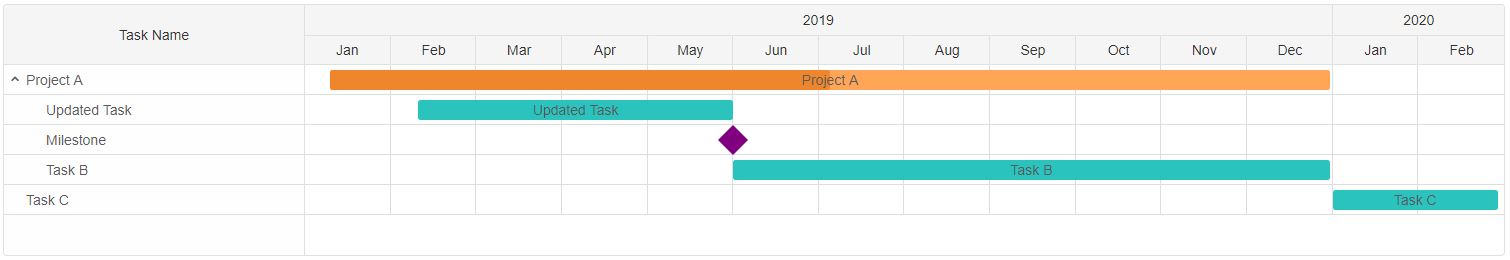
updateTask allows the user to edit the settings of a Task:
          const ganttChart = document.querySelector('smart-gantt-chart'),
               taskSettings = {
                    label: 'Updated Task',
                    dateStart: '2026-02-10',
                    dateEnd: '2026-06-01'
                };

            //Updates the settings of Task 1
            ganttChart.updateTask(1, taskSettings);
Demo
Tasks can also be inserted or removed via methods:
-
insertTask can be used to insert a new Task. Tasks can be inserted before or after another. Although the user can insert a Project Task with sub-projects( or/and tasks).
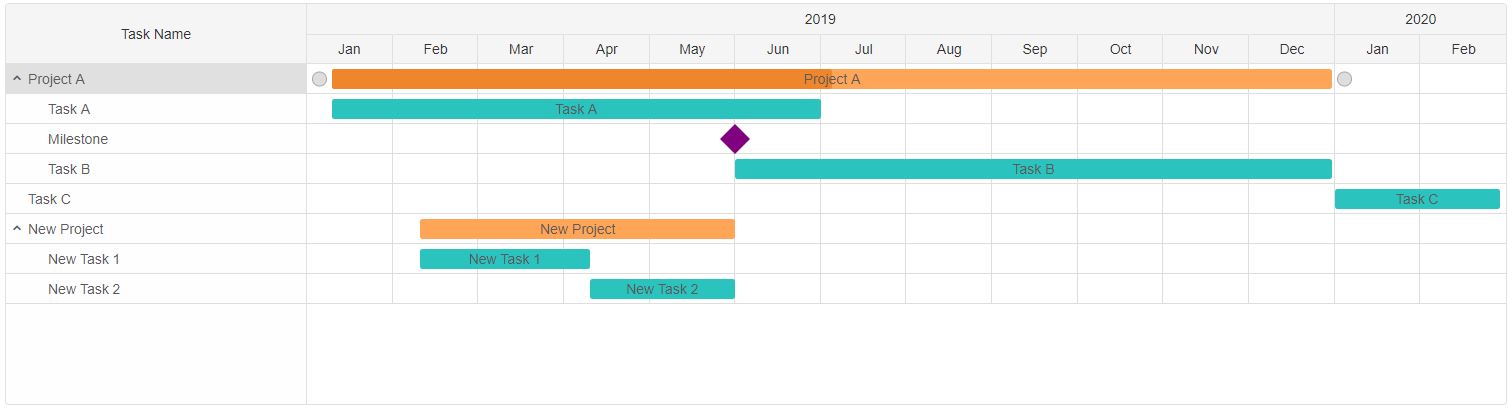
          const ganttChart = document.querySelector('smart-gantt-chart'),
               newProjectTask = {
                    type: 'project',
                    label: 'New Project',
                    dateStart: '2026-02-10',
                    dateEnd: '2026-06-01',
                    expanded: true,
                    tasks: [
                        {
                            type: 'task',
                            label: 'New Task 1',
                            dateStart: '2026-02-10',
                            dateEnd: '2026-04-10',
                        },
                        {
                            type: 'task',
                            label: 'New Task 2',
                            dateStart: '2026-04-10',
                            dateEnd: '2026-06-01',
                        }
                    ]
                };

            //Updates the settings of Task 1
            ganttChart.insertTask(1, taskSettings);
Let's insert a new Project with two sub-tasks in the end of the task list:
Demo
-
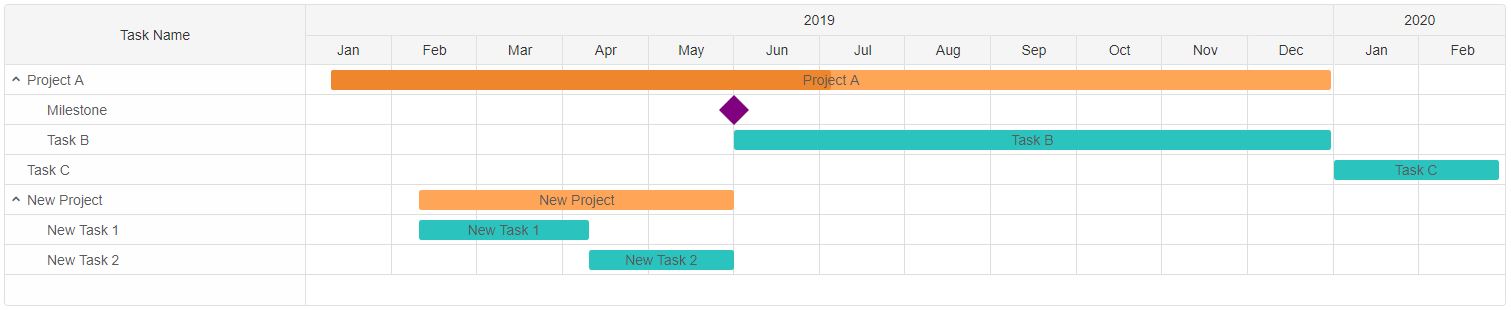
removeTask deletes a Task from the list and all of it's connections. This method requires only a Task index to be passed as an argument to delete the corresponding task.
For example, let's remove 'Task A' from 'Project A':
          const ganttChart = document.querySelector('smart-gantt-chart');

            //Removes Task with index 1
            ganttChart.removeTask(1);
Demo
Task connections can't be edited. When creating a new task on a task that already has a connection the present is removed and the new one is created.
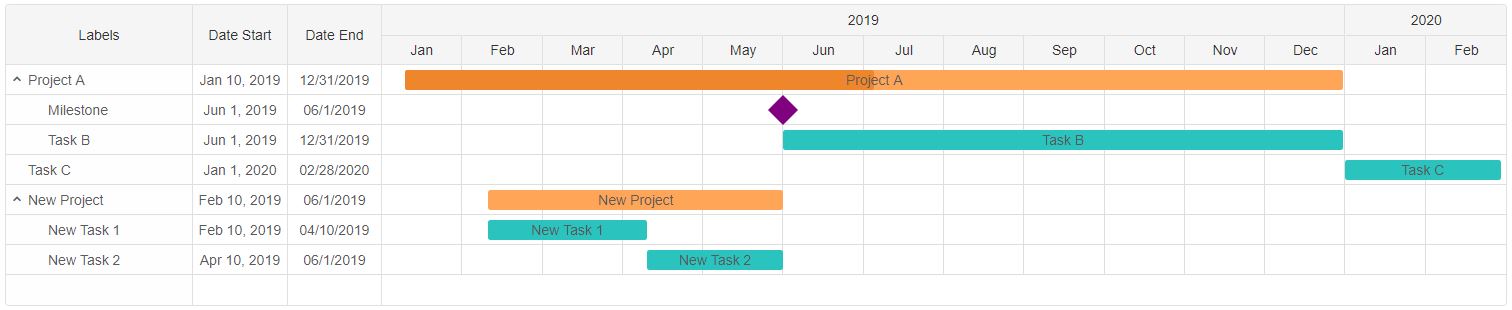
Task Tree columns can also be edited. The user can set which properties of the Tasks should be visible inside the Task Tree as separate columns.
taskColumns property determines the columns inside the Task Tree. It accepts an array of objects. Each object determines the properties for the column. Here's an example:
          const ganttChart = document.querySelector('smart-gantt-chart');

            //Set a new Size for the Task Tree
            ganttChart.treeSize = '25%';

            //Configure the Tree Task Columns
            ganttChart.taskColumns = [
                {
                    label: 'Labels',
                    value: 'label'
                },
                {
                    label: 'Date Start',
                    value: 'dateStart',
                    size: '25%',
                    //Custom format function
                    formatFunction: function(date) {
                        return new Date(date).toLocaleDateString(ganttChart.locale, {
                            year: 'numeric',
                            month: 'short',
                            day: 'numeric'
                        });
                    }
                },
                {
                    label: 'Date End',
                    value: 'dateEnd',
                    size: '25%'
                }
            ];
Demo
Auto Schedule
Auto schedule re-calculates the starting dates of all connected tasks and re-schedules them in order to meet the requirements defined by the connections. When autoSchedule is set scheduled tasks have date restrictions in order to assure that a task doesn't start or end on an invalid date. When changing the duration or start/end dates of a task that is connected to another, it's siblings are re-scheduled when the operation is completed.
autoScheduleStrictMode is an additional feature that locks the tasks and re-schedules them strictly to their optimal start/end dates. Once locked the tasks can't be dragged nor resized.
Connection's lag attribute is used by the Auto scheduling algorithm in order allow some slack time before or after the next task begins/ends. Lag accepts a number and is measured in miliseconds. It can be a negative ('lead') or a positive ('lag') number.
Here's an example:
          const ganttChart = document.querySelector('smart-gantt-chart');

            ganttChart.dataSource = [
            {
                label: 'Project 1',
                dateStart: '2023-03-10T12:30:00',
                dateEnd: '2026-06-10T3:59:00',
                type: 'project',
                expanded: true,
                connections: [
                    {
                        target: 1,
                        type: 0,
                        lag: 2 * 24 * 60 * 60 * 1000 //2 days lag
                    }
                ],
                tasks: [
                    {
                        label: 'Task 1.1',
                        dateStart: '2023-02-10',
                        dateEnd: '2026-01-10',
                        type: 'task',
                        connections: [
                            {
                                target: 2,
                                type: 1,
                                lag: -5 * 24 * 60 * 60 * 1000 // -5 days lag
                            },
                            {
                                target: 4,
                                type: 1
                            }
                        ]
                    },
                    {
                        label: 'Task 1.2',
                        dateStart: '2023-10-10',
                        dateEnd: '2026-2-31',
                        type: 'task',
                        connections: [
                            {
                                target: 3,
                                type: 1,
                                lag: 15 * 24 * 60 * 60 * 1000 // 15 days lag
                            }
                        ]
                    }
                ]
            },
            {
                label: 'Task 2',
                dateStart: '2023-03-10T15:30:00',
                dateEnd: '2026-08-10',
                type: 'task'
            },
            {
                label: 'Milestone 1',
                dateEnd: '2026-05-24',
                type: 'milestone',
                connections: [
                    {
                        target: 5,
                        type: 1,
                        lag: 5 * 24 * 60 * 60 * 1000 //5 days lag
                    }
                ]
            },
            {
                label: 'Task 3',
                dateStart: '2026-02-05',
                dateEnd: '2026-07-08',
                progress: 50,
                type: 'task'
            }
        ];

        ganttChart.autoScheduleStrictMode = true;
Demo
Save/Load State
Most GanttChart users make frequent changes to the Tasks. Some of them might not agree with the changes made by others or a restore point might be required. For that purpose saving the current state of the Timeline is crucial. Several restore points could be created so different states of the Timeline can be reloaded. The GanttChart element offers the following methods for State Maintanance:
- getState - returns the current list of Tasks and their settings. Can set directly as dataSource.
- saveState - saves the current state of the GanttChart to localStorage. Requires an ID to be set to the element.
- loadState - loads a previously saved state of the element. Accepts one argument - the state to load to. If no arguments are provided, localStorage lookup will be performed in order to find a previously saved state according to the id of the element. Requires an ID to be set to the element.
- clearState - removes any stored state of the element according to it's id. Requires an ID to be set to the element.
 const ganttChart = document.querySelector('smart-gantt-chart');

 let savedState = ganttChart.getState();

//Make some changes to the tasks
//...

//Reload the element with the saved tasks
 ganttChart.loadState(savedState);

//Clear the saved state
 ganttChart.clearState();
Common Use Cases
-
Load tasks from JSON
Populate Gantt chart with task data
gantt.dataSource = tasksArray;
-
Add task dependencies
Link tasks with predecessor relationships
gantt.dataSource = [{ label: 'Task 1', dateStart: '2026-01-01', dateEnd: '2026-01-05' }, { label: 'Task 2', dateStart: '2026-01-06', dateEnd: '2026-01-10', connections: [{ target: 0, type: 1 }] }]; -
Export to PDF
Generate a PDF of the Gantt chart
gantt.exportData('pdf', 'GanttExport');
Troubleshooting
- Why are my task dependencies not showing?
- Ensure connections array in each task uses valid target indices and connection type values. Type 0 = start-to-start, 1 = end-to-start.
- How do I change the time scale?
- Set durationUnit to 'hour', 'day', 'week', or 'month' and configure view settings accordingly.
Accessibility
The GanttChart component follows WAI-ARIA best practices:
- Keyboard navigation - Tab, Arrow keys, Enter, and Escape are supported
- ARIA roles - Appropriate roles and labels are applied automatically
- Focus management - Visible focus indicators for keyboard users
- Screen readers - State changes are announced to assistive technology
- High contrast - Supports Windows High Contrast Mode and forced colors
For custom labeling, set aria-label or aria-labelledby attributes on the component.
Supported stacks: Smart UI targets Angular 17+, React 18+, Vue 3+, Node 18 LTS, and evergreen browsers; pin exact package versions to your org policy.