Getting Started with Chart Web Component
Smart UI Web Components work with current evergreen browsers and Node 18+ for local tooling; pin package versions to match your project policy.
Smart UI is distributed as the smart-webcomponents NPM package. You can also use the full download from the Download page.
Quick start
- Install the package:
npm install smart-webcomponents
- Load the Chart module (ES module script):
<script type="module" src="node_modules/smart-webcomponents/source/modules/smart.chart.js"></script>
- Add the default stylesheet (prefer angular.json / bundler entry in app codebases; for plain HTML use a link):
<link rel="stylesheet" type="text/css" href="node_modules/smart-webcomponents/source/styles/smart.default.css" />
- Add markup in one of two ways - semantic custom element (the component tag is in your HTML) or a host
div(you mount programmatically with appendTo):
Semantic element (id matches the selector in Smart()):
<smart-chart id="chart"></smart-chart>
Host container (id matches appendTo on Smart.Chart):
<div id="chartContainer"></div>
- Initialize after the module loads: define a const chartOptions object, then either bind with Smart('#chart', ...) on the semantic tag or use new Smart.Chart({ ...chartOptions, appendTo: '#chartContainer' }) on the host
div:
<script type="module">
	import 'node_modules/smart-webcomponents/source/modules/smart.chart.js';

	const chartOptions = {
				caption: "Fitness & exercise weekly scorecard",
				description: "Time spent in vigorous exercise by activity",
				enableAnimations: true,
				showLegend: true,
				padding: { left: 10, top: 10, right: 15, bottom: 10 },
				titlePadding: { left: 90, top: 0, right: 0, bottom: 10 },
				dataSource: [
						{ Day: 'Monday', Running: 30, Swimming: 10, Cycling: 25, Goal: 40 },
						{ Day: 'Tuesday', Running: 25, Swimming: 15, Cycling: 10, Goal: 50 },
						{ Day: 'Wednesday', Running: 30, Swimming: 10, Cycling: 25, Goal: 60 },
						{ Day: 'Thursday', Running: 40, Swimming: 20, Cycling: 25, Goal: 40 },
						{ Day: 'Friday', Running: 45, Swimming: 20, Cycling: 25, Goal: 50 },
						{ Day: 'Saturday', Running: 30, Swimming: 20, Cycling: 30, Goal: 60 },
						{ Day: 'Sunday', Running: 20, Swimming: 30, Cycling: 10, Goal: 90 }
				],
				colorScheme: 'scheme13',
				xAxis: {
					dataField: 'Day',
					unitInterval: 2,
					tickMarks: { visible: true, interval: 1 },
					gridLinesInterval: { visible: true, interval: 1 },
					valuesOnTicks: false,
					padding: { bottom: 10 }
				},
				valueAxis: {
					unitInterval: 10,
					minValue: 0,
					maxValue: 50,
					title: { text: 'Time in minutes' },
					labels: { horizontalAlignment: 'right' }
				},
				seriesGroups:
					[
						{
							type: 'spline',
							series:
							[
								{
									dataField: 'Swimming',
									symbolType: 'square',
									labels:
									{
										visible: true,
										backgroundColor: '#FEFEFE',
										backgroundOpacity: 0.2,
										borderColor: '#7FC4EF',
										borderOpacity: 0.7,
										padding: { left: 5, right: 5, top: 0, bottom: 0 }
									}
								},
								{
									dataField: 'Running',
									symbolType: 'square',
									labels:
									{
										visible: true,
										backgroundColor: '#FEFEFE',
										backgroundOpacity: 0.2,
										borderColor: '#7FC4EF',
										borderOpacity: 0.7,
										padding: { left: 5, right: 5, top: 0, bottom: 0 }
									}
								}
							]
						}
					]
			};

	// Option A - semantic <smart-chart> with id="chart"
	Smart('#chart', class {
		get properties() {
			return chartOptions;
		}
	});

	// Option B - host div id="chartContainer"
	// const chartInstance = new Smart.Chart({
	// 	...chartOptions,
	// 	appendTo: '#chartContainer'
	// });

	// Option C - constructor(selector, options), then append the returned element yourself
	// const myChart = new Smart.Chart('#chart', chartOptions);
	// document.body.appendChild(myChart);
</script>
Uncomment Option B when you use the host
div; use Option A when you use the semantic element. The Runtime cookbook also documents new Smart.Chart('#chart', chartOptions) with appendChild, and document.createElement('smart-chart') with .props or Object.assign (all are valid patterns; do not combine overlapping patterns for the same instance unless you intend multiple components). - Serve the folder over HTTP (or use your bundler dev server) and open the page.
Runtime cookbook
Alternative creation patterns and imperative APIs. These are all valid ways to create Smart UI components: semantic markup + Smart(); new Smart.Chart({ ...options, appendTo: '#...' }); new Smart.Chart('#chart', chartOptions) plus appendChild on the returned element; and document.createElement('smart-chart') then assigning options via .props or Object.assign on the element.
Constructor with a selector string and options, then append the returned element (for example const myChart = new Smart.Chart('#chart', chartOptions)):
	const chartOptions = {
				caption: "Fitness & exercise weekly scorecard",
				description: "Time spent in vigorous exercise by activity",
				enableAnimations: true,
				showLegend: true,
				padding: { left: 10, top: 10, right: 15, bottom: 10 },
				titlePadding: { left: 90, top: 0, right: 0, bottom: 10 },
				dataSource: [
						{ Day: 'Monday', Running: 30, Swimming: 10, Cycling: 25, Goal: 40 },
						{ Day: 'Tuesday', Running: 25, Swimming: 15, Cycling: 10, Goal: 50 },
						{ Day: 'Wednesday', Running: 30, Swimming: 10, Cycling: 25, Goal: 60 },
						{ Day: 'Thursday', Running: 40, Swimming: 20, Cycling: 25, Goal: 40 },
						{ Day: 'Friday', Running: 45, Swimming: 20, Cycling: 25, Goal: 50 },
						{ Day: 'Saturday', Running: 30, Swimming: 20, Cycling: 30, Goal: 60 },
						{ Day: 'Sunday', Running: 20, Swimming: 30, Cycling: 10, Goal: 90 }
				],
				colorScheme: 'scheme13',
				xAxis: {
					dataField: 'Day',
					unitInterval: 2,
					tickMarks: { visible: true, interval: 1 },
					gridLinesInterval: { visible: true, interval: 1 },
					valuesOnTicks: false,
					padding: { bottom: 10 }
				},
				valueAxis: {
					unitInterval: 10,
					minValue: 0,
					maxValue: 50,
					title: { text: 'Time in minutes' },
					labels: { horizontalAlignment: 'right' }
				},
				seriesGroups:
					[
						{
							type: 'spline',
							series:
							[
								{
									dataField: 'Swimming',
									symbolType: 'square',
									labels:
									{
										visible: true,
										backgroundColor: '#FEFEFE',
										backgroundOpacity: 0.2,
										borderColor: '#7FC4EF',
										borderOpacity: 0.7,
										padding: { left: 5, right: 5, top: 0, bottom: 0 }
									}
								},
								{
									dataField: 'Running',
									symbolType: 'square',
									labels:
									{
										visible: true,
										backgroundColor: '#FEFEFE',
										backgroundOpacity: 0.2,
										borderColor: '#7FC4EF',
										borderOpacity: 0.7,
										padding: { left: 5, right: 5, top: 0, bottom: 0 }
									}
								}
							]
						}
					]
			};
	const myChart = new Smart.Chart('#chart', chartOptions);
	document.body.appendChild(myChart);
Create with document.createElement('smart-chart'), assign properties (same as any custom element), then append:
	const chartOptions = {
				caption: "Fitness & exercise weekly scorecard",
				description: "Time spent in vigorous exercise by activity",
				enableAnimations: true,
				showLegend: true,
				padding: { left: 10, top: 10, right: 15, bottom: 10 },
				titlePadding: { left: 90, top: 0, right: 0, bottom: 10 },
				dataSource: [
						{ Day: 'Monday', Running: 30, Swimming: 10, Cycling: 25, Goal: 40 },
						{ Day: 'Tuesday', Running: 25, Swimming: 15, Cycling: 10, Goal: 50 },
						{ Day: 'Wednesday', Running: 30, Swimming: 10, Cycling: 25, Goal: 60 },
						{ Day: 'Thursday', Running: 40, Swimming: 20, Cycling: 25, Goal: 40 },
						{ Day: 'Friday', Running: 45, Swimming: 20, Cycling: 25, Goal: 50 },
						{ Day: 'Saturday', Running: 30, Swimming: 20, Cycling: 30, Goal: 60 },
						{ Day: 'Sunday', Running: 20, Swimming: 30, Cycling: 10, Goal: 90 }
				],
				colorScheme: 'scheme13',
				xAxis: {
					dataField: 'Day',
					unitInterval: 2,
					tickMarks: { visible: true, interval: 1 },
					gridLinesInterval: { visible: true, interval: 1 },
					valuesOnTicks: false,
					padding: { bottom: 10 }
				},
				valueAxis: {
					unitInterval: 10,
					minValue: 0,
					maxValue: 50,
					title: { text: 'Time in minutes' },
					labels: { horizontalAlignment: 'right' }
				},
				seriesGroups:
					[
						{
							type: 'spline',
							series:
							[
								{
									dataField: 'Swimming',
									symbolType: 'square',
									labels:
									{
										visible: true,
										backgroundColor: '#FEFEFE',
										backgroundOpacity: 0.2,
										borderColor: '#7FC4EF',
										borderOpacity: 0.7,
										padding: { left: 5, right: 5, top: 0, bottom: 0 }
									}
								},
								{
									dataField: 'Running',
									symbolType: 'square',
									labels:
									{
										visible: true,
										backgroundColor: '#FEFEFE',
										backgroundOpacity: 0.2,
										borderColor: '#7FC4EF',
										borderOpacity: 0.7,
										padding: { left: 5, right: 5, top: 0, bottom: 0 }
									}
								}
							]
						}
					]
			};
	const chart = document.createElement('smart-chart');
	Object.assign(chart, chartOptions);
	document.body.appendChild(chart);
Host on a div with appendTo (import the module, then instantiate when the document is ready; the container id must match appendTo):
	import "../../source/modules/smart.chart.js";

	document.readyState === 'complete' ? init() : window.addEventListener('load', init);

	function init() {
		const chartOptions = {
				caption: "Fitness & exercise weekly scorecard",
				description: "Time spent in vigorous exercise by activity",
				enableAnimations: true,
				showLegend: true,
				padding: { left: 10, top: 10, right: 15, bottom: 10 },
				titlePadding: { left: 90, top: 0, right: 0, bottom: 10 },
				dataSource: [
						{ Day: 'Monday', Running: 30, Swimming: 10, Cycling: 25, Goal: 40 },
						{ Day: 'Tuesday', Running: 25, Swimming: 15, Cycling: 10, Goal: 50 },
						{ Day: 'Wednesday', Running: 30, Swimming: 10, Cycling: 25, Goal: 60 },
						{ Day: 'Thursday', Running: 40, Swimming: 20, Cycling: 25, Goal: 40 },
						{ Day: 'Friday', Running: 45, Swimming: 20, Cycling: 25, Goal: 50 },
						{ Day: 'Saturday', Running: 30, Swimming: 20, Cycling: 30, Goal: 60 },
						{ Day: 'Sunday', Running: 20, Swimming: 30, Cycling: 10, Goal: 90 }
				],
				colorScheme: 'scheme13',
				xAxis: {
					dataField: 'Day',
					unitInterval: 2,
					tickMarks: { visible: true, interval: 1 },
					gridLinesInterval: { visible: true, interval: 1 },
					valuesOnTicks: false,
					padding: { bottom: 10 }
				},
				valueAxis: {
					unitInterval: 10,
					minValue: 0,
					maxValue: 50,
					title: { text: 'Time in minutes' },
					labels: { horizontalAlignment: 'right' }
				},
				seriesGroups:
					[
						{
							type: 'spline',
							series:
							[
								{
									dataField: 'Swimming',
									symbolType: 'square',
									labels:
									{
										visible: true,
										backgroundColor: '#FEFEFE',
										backgroundOpacity: 0.2,
										borderColor: '#7FC4EF',
										borderOpacity: 0.7,
										padding: { left: 5, right: 5, top: 0, bottom: 0 }
									}
								},
								{
									dataField: 'Running',
									symbolType: 'square',
									labels:
									{
										visible: true,
										backgroundColor: '#FEFEFE',
										backgroundOpacity: 0.2,
										borderColor: '#7FC4EF',
										borderOpacity: 0.7,
										padding: { left: 5, right: 5, top: 0, bottom: 0 }
									}
								}
							]
						}
					]
			};
		const chart = new Smart.Chart({
			...chartOptions,
			appendTo: '#chartContainer'
		});
	}
Basic Concepts
Before you start using Smart.Chart, you need to learn how it works and some basic concepts. Depending on which features you use, your chart may contain the following elements:
- horizontal axis (xAxis)
- vertical axis (valueAxis)
- caption & description
- one or more series groups and series
- grid lines & tick marks
- legend
- border line
- background
- tooltips
- annotations
- range selector
Some simple charts may not have all of these elements, while complicated charts could be highly customized and even include additional elements added through custom drawing.
The following image illustrates the different elements in Smart.Chart:

Getting Started
Include All Required JavaScript & CSS files
Create an HTML page and include the following references in the head section:
<link rel="stylesheet" type="text/css" href="../../source/styles/smart.default.css" />
<script type="text/javascript" src="../../source/smart.elements.js"></script>
Create the Custom Element
In the body section of the page, create the smart-chart custom element:
<smart-chart id="chart"></smart-chart>
Prepare Sample Data
In a script on the page, create an array of objects to use as sample data:
const sampleData = [
    { Day: 'Monday', Keith: 30, Erica: 15, George: 25 },
    { Day: 'Tuesday', Keith: 25, Erica: 25, George: 30 },
    { Day: 'Wednesday', Keith: 30, Erica: 20, George: 25 },
    { Day: 'Thursday', Keith: 35, Erica: 25, George: 45 },
    { Day: 'Friday', Keith: 20, Erica: 20, George: 25 },
    { Day: 'Saturday', Keith: 30, Erica: 20, George: 30 },
    { Day: 'Sunday', Keith: 60, Erica: 45, George: 90 }
];
Apply the Chart Settings
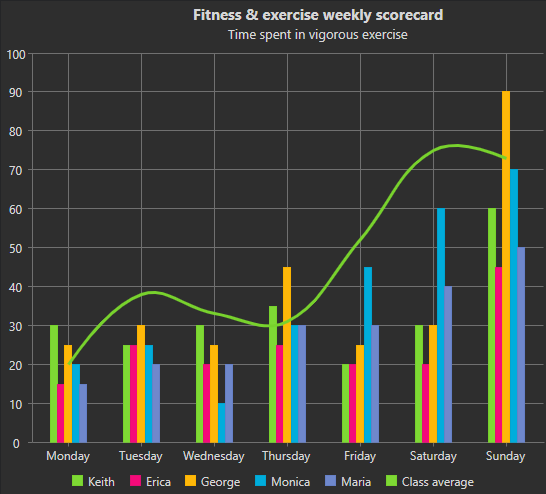
The final step is to prepare the chart display settings. The code below specifies the caption and description that the chart will display and sets the dataSource property. In this example, we bind the (horizontal) xAxis to the Day property of our data source. The chart will display the data in three series of type 'column'. Each of the series is bound to another property in our data source.
Here is the complete code of the example:
<!DOCTYPE html>
<html xmlns="http://www.w3.org/1999/xhtml">
<head>
    <title>Chart Column Series Example</title>
    <link rel="stylesheet" type="text/css" href="../../source/styles/smart.default.css" />
    <script type="text/javascript" src="../../source/smart.elements.js"></script>
    <script type="text/javascript">
        const sampleData = [
            { Day: 'Monday', Keith: 30, Erica: 15, George: 25 },
            { Day: 'Tuesday', Keith: 25, Erica: 25, George: 30 },
            { Day: 'Wednesday', Keith: 30, Erica: 20, George: 25 },
            { Day: 'Thursday', Keith: 35, Erica: 25, George: 45 },
            { Day: 'Friday', Keith: 20, Erica: 20, George: 25 },
            { Day: 'Saturday', Keith: 30, Erica: 20, George: 30 },
            { Day: 'Sunday', Keith: 60, Erica: 45, George: 90 }
        ];

        Smart('#chart', class {
            get properties() {
                return {
                    caption: 'Fitness & exercise weekly scorecard',
                    description: 'Time spent in vigorous exercise',
                    dataSource: sampleData,
                    colorScheme: 'scheme29',
                    padding: {
                        left: 10,
                        right: 25
                    },
                    xAxis:
                    {
                        dataField: 'Day',
                        gridLines: {
                            visible: true
                        }
                    },
                    valueAxis:
                    {
                        description: 'Time in minutes',
                        axisSize: 'auto',
                        minValue: 0,
                        maxValue: 100,
                        unitInterval: 10
                    },
                    seriesGroups:
                        [
                            {
                                type: 'column',
                                orientation: 'vertical',
                                columnsGapPercent: 50,
                                seriesGapPercent: 0,
                                series: [
                                    { dataField: 'Keith', displayText: 'Keith' },
                                    { dataField: 'Erica', displayText: 'Erica' },
                                    { dataField: 'George', displayText: 'George' }
                                ]
                            }
                        ]
                };
            }
        });
    </script>
</head>
<body>
    <smart-chart id="chart"></smart-chart>
</body>
</html>
The resulting Chart is shown in the following image:

Append to the DOM:
const container = document.getElementById('chart-container');
container.appendChild(chart);
Remove from the DOM:
chart.remove();
Set a property:
chart.disabled = true;
chart.theme = 'dark';
Get a property value:
const isDisabled = chart.disabled;
const currentTheme = chart.theme;
Invoke a method:
chart.refresh();
chart.focus();
Add event listener:
chart.addEventListener('click', (event) => {
    console.log('click triggered:', event.detail);
});
Remove event listener:
const handleChartEvent = (event) => {
    console.log('click triggered:', event.detail);
};

chart.addEventListener('click', handleChartEvent);
chart.removeEventListener('click', handleChartEvent);
Common Use Cases
-
Update chart data dynamically
Refresh chart with new data points
chart.dataSource = newDataArray;
chart.refresh();
-
Change chart type
Switch between chart types like line, bar, pie
chart.seriesGroups[0].type = 'column';
chart.refresh();
-
Export chart as image
Save the chart as a PNG or JPEG file
chart.saveAsImage('chart.png', 'image/png');
Troubleshooting
- Why is my chart blank?
- Verify dataSource contains data and seriesGroups are configured with valid dataField references matching your data keys.
- How do I update chart data dynamically?
- Reassign the dataSource property and call chart.refresh() to redraw with new data.
- How do I change the chart colors?
- Set the colorScheme property (e.g., 'scheme01' to 'scheme32') or define custom colors in seriesGroups series configuration.
Accessibility
The Chart component follows WAI-ARIA best practices:
- Keyboard navigation - Tab, Arrow keys, Enter, and Escape are supported
- ARIA roles - Appropriate roles and labels are applied automatically
- Focus management - Visible focus indicators for keyboard users
- Screen readers - State changes are announced to assistive technology
- High contrast - Supports Windows High Contrast Mode and forced colors
For custom labeling, set aria-label or aria-labelledby attributes on the component.
Supported stacks: Smart UI targets Angular 17+, React 18+, Vue 3+, Node 18 LTS, and evergreen browsers; pin exact package versions to your org policy.