Getting Started with Vue Chart Component
Smart UI Vue examples target Vue 3 and Vite; enable TypeScript in create-vue when you want typed SFCs.
Demo source (Smart UI repo): vue/vue-3/src/chart/events/App.vue
Scaffold with Vite (Vue 3)
Run the official scaffolding tool:
npm create vue@latest
You will be prompted for TypeScript, Router, Pinia, and other options. When unsure, accept defaults and enable features later.
cd <your-project-name>
npm install
npm install smart-webcomponents
npm run dev
Vue + TypeScript
If you enabled TypeScript, use vite.config.ts with the same isCustomElement configuration as below so the compiler treats Smart UI tags as native custom elements.
Teach Vue about custom elements
Without this, Vue warns about unknown custom elements. Open vite.config.js or vite.config.ts and configure the Vue plugin so smart-* and legacy jqx-* tags are passed through to the DOM:
import { fileURLToPath, URL } from 'node:url'

import { defineConfig } from 'vite'
import vue from '@vitejs/plugin-vue'

export default defineConfig({
  plugins: [
    vue({
      template: {
        compilerOptions: {
          isCustomElement: tag => tag.startsWith('smart-') || tag.startsWith('jqx-')
        }
      }
    })
  ],
  resolve: {
    alias: {
      '@': fileURLToPath(new URL('./src', import.meta.url))
    }
  }
})
App.vue example
Example from Smart UI Vue 3 demos for this widget:
<template>
<div class="vue-root">
<smart-chart id="chart"></smart-chart>
<br />
<div id="eventText"></div>
</div>
</template>
<script>
import { onMounted } from "vue";
import "smart-webcomponents/source/styles/smart.default.css";
import "smart-webcomponents/source/modules/smart.chart.js";
export default {
name: "app",
setup() {
onMounted(() => {
const sampleData = [
{
Day: "Monday",
Keith: 30,
Erica: 15,
George: 25
},
{
Day: "Tuesday",
Keith: 25,
Erica: 25,
George: 30
},
{
Day: "Wednesday",
Keith: 30,
Erica: 20,
George: 25
},
{
Day: "Thursday",
Keith: 35,
Erica: 25,
George: 45
},
{
Day: "Friday",
Keith: 20,
Erica: 20,
George: 25
},
{
Day: "Saturday",
Keith: 30,
Erica: 20,
George: 30
},
{
Day: "Sunday",
Keith: 60,
Erica: 45,
George: 90
}
];
window.Smart(
"#chart",
class {
get properties() {
return {
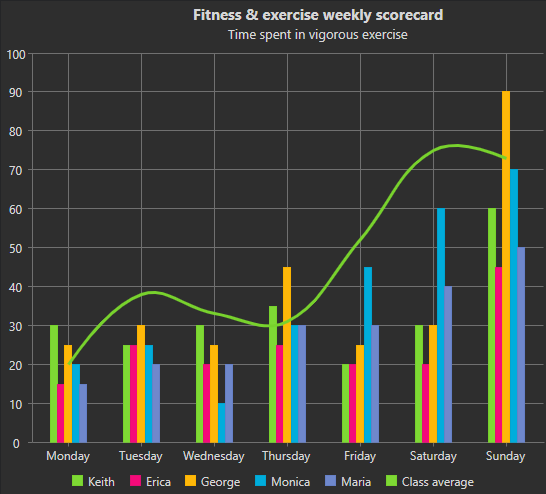
caption: "Fitness & exercise weekly scorecard",
description: "Time spent in vigorous exercise",
padding: {
left: 5,
top: 5,
right: 5,
bottom: 5
},
titlePadding: {
left: 90,
top: 0,
right: 0,
bottom: 10
},
dataSource: sampleData,
xAxis: {
dataField: "Day",
type: "basic"
},
colorScheme: "scheme32",
showToolTips: false,
seriesGroups: [
{
type: "column",
valueAxis: {
minValue: 0,
maxValue: 100,
unitInterval: 10,
title: {
text: "Time in minutes"
}
},
series: [
{
dataField: "Keith",
displayText: "Keith"
},
{
dataField: "Erica",
displayText: "Erica"
},
{
dataField: "George",
displayText: "George"
}
]
}
]
};
}
}
);
function myEventHandler(event) {
const eventDetail = event.detail;
if (!eventDetail) {
return;
}
let eventData =
"<div><b>Last Event: </b>" +
event.type +
"<b>, Serie DataField: </b>" +
eventDetail.serie.dataField +
"<b>, Value: </b>" +
eventDetail.elementValue +
"</div>";
if (event.type === "toggle") {
eventData =
"<div><b>Last Event: </b>" +
event.type +
"<b>, Serie DataField: </b>" +
eventDetail.serie.dataField +
"<b>, visible: </b>" +
eventDetail.state +
"</div>";
}
document.getElementById("eventText").innerHTML = eventData;
}
const chart = document.getElementById("chart");
chart.addEventListener("mouseout", function(event) {
myEventHandler(event);
});
chart.addEventListener("mouseover", function(event) {
myEventHandler(event);
});
chart.addEventListener("click", function(event) {
myEventHandler(event);
});
chart.addEventListener("toggle", function(event) {
myEventHandler(event);
});
});
}
};
</script>
<style>
smart-chart {
width: 100%;
max-width: 850px;
}
</style>
You can now use smart-chart in templates; bindings and events follow Vue's normal syntax.
Run and build
Development server:
npm run dev
Then open http://localhost:5173/.
Production build:
npm run build
Output goes to ./dist.
Read more about using Smart UI for Vue.
Common Use Cases
-
Update chart data dynamically
Refresh chart with new data points
chart.dataSource = newDataArray;
chart.refresh();
-
Change chart type
Switch between chart types like line, bar, pie
chart.seriesGroups[0].type = 'column';
chart.refresh();
-
Export chart as image
Save the chart as a PNG or JPEG file
chart.saveAsImage('chart.png', 'image/png');
Troubleshooting
- Why is my chart blank?
- Verify dataSource contains data and seriesGroups are configured with valid dataField references matching your data keys.
- How do I update chart data dynamically?
- Reassign the dataSource property and call chart.refresh() to redraw with new data.
- How do I change the chart colors?
- Set the colorScheme property (e.g., 'scheme01' to 'scheme32') or define custom colors in seriesGroups series configuration.
Accessibility
The Chart component follows WAI-ARIA best practices:
- Keyboard navigation - Tab, Arrow keys, Enter, and Escape are supported
- ARIA roles - Appropriate roles and labels are applied automatically
- Focus management - Visible focus indicators for keyboard users
- Screen readers - State changes are announced to assistive technology
- High contrast - Supports Windows High Contrast Mode and forced colors
For custom labeling, set aria-label or aria-labelledby attributes on the component.
Supported stacks: Smart UI targets Angular 17+, React 18+, Vue 3+, Node 18 LTS, and evergreen browsers; pin exact package versions to your org policy.